Laying out your map is a lot like arranging furniture: You need functionality, balance, and just a touch of flair. A skilled cartographer, a graphic designer, or even an interior decorator can create some amazing designs, but you don’t have to be one to make a good map. Follow the tips in this lesson, and you’ll be turning your okay maps into really good ones — maybe even better than that really good jerky you bought on your last road trip!
Think about the last map you saw that truly caught your attention. What specific elements made it effective or memorable?
Using Essential Map Elements
Map elements are all the pieces it takes to build a map. They’re the parts necessary for reading and understanding your map’s story. Here’s a quick overview of them:
- Title: The title sets the stage by letting readers know what the map is about.
- Legend: The legend is your map’s decoder ring. It explains the symbols, colors, and classes.
- Scale bar: This element provides context for size and distance, helping users understand the map’s level of generalization in relation to a location on the Earth itself.
- North arrow: Along with the scale bar, the north arrow allows readers to understand the orientation of your map. This symbol is often considered optional when the fact that “up is north” on your map is obvious. However, many GIS folks will argue that it’s a required element for every map. Just pose the question to #GISchat friends on social media and you’ll see what I mean.
- Credits: Give credit where credit is due and always list your sources. And hey, here’s where you can take credit for your hard work, too. Nothing wrong with that!
- Mapped areas: These areas are the star of the show, and your data takes center stage! Some maps may include an inset map to provide a reference location for the main map.
- Graticule: A graticule is a grid of longitude and latitude lines, making it useful for a map that requires precise geographic reference. Often used to show scale and position of mapped objects, a graticule is optional, but it makes your map look polished and professional.
- Borders: Borders around the map area are sometimes called neat lines because they give it an orderly and finished look.
- Symbols: Symbols represent real-world features, and no map is complete without them.
- Labels: Labels provide names for places on your map so that users can orient themselves. Use bold or slightly larger font size to call attention to features you want to highlight.

Map element standards evolve over time. What people consider to be essential today may change tomorrow, so keep an eye on current practices.
The debate over whether a north arrow is always necessary can get surprisingly heated among GIS professionals—some argue it’s essential for every map, while others say it’s optional if orientation is obvious.
Why do you think giving credit (through map credits) is important in cartography and GIS?
Factoring in Graphic Design
A well-designed map is like eye candy: Everything fits together in a nice and sweet way. Good design can turn complex data into an understandable story, whereas bad design can leave your audience lost and confused. The best way to get started designing your map is to think like a graphic designer. I’m not saying that you need to be a graphic designer; just think like one. If you understand concepts like choosing fonts and using color, you’re partway there already! To ensure that your map is designed in a way that tells the story you want to tell, ask yourself these questions:
- Is it balanced? Take a look at your map and note where your eyes go when you first look at it. Check whether your scale bar is large and disproportionate to the rest of the elements, or whether one side looks heavy or cluttered. If so, move elements around or resize them to create harmony.
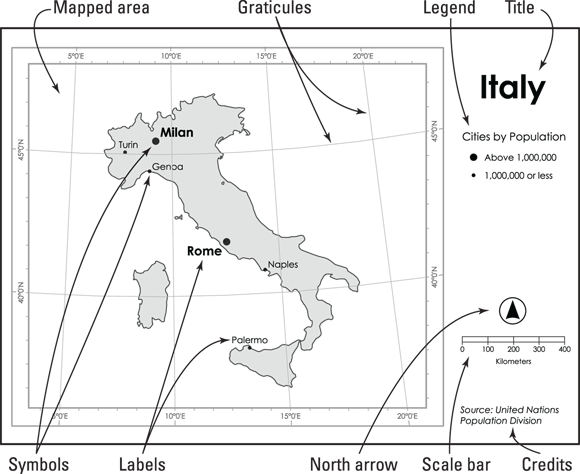 The anatomy of a map: How essential elements are arranged for clarity and balance.
- Can readers see the text? Fonts should be legible from the distance you expect your audience to view the map. For example, if you’re creating a poster, print it at full size, hang it up, and step back to see how it reads. If you’re designing a web map, be sure to check it on different screen sizes.
- Do the features pop? Use color contrast to make important features stand out. Darker, bold (saturated), and warm (red/yellow undertones) colors tend to stand out, whereas lighter, pale, and cool (blue undertones) colors tend to work well for supporting elements and background.
- Does your map guide the reader’s focus? Use color contrast and visual hierarchy (like different line thicknesses) to emphasize key features and guide the focus of your map. A good map should be able to guide a reader through the story, beginning with the title and then drawing the eyes to the various elements that tell the story (the map, the legend, and maybe some other visuals).
- Is it comfortable to look at? Avoid clashing colors, busy patterns, or dizzying visuals that can overwhelm your audience. Removing clutter from your map can help. Try these tips:
- Collapse categories: If you have a lot of categories that create an abundance of colors on your map, try grouping them logically to reduce the categories. For example, for land ownership, consider using broad categories like “Federal Land,” “State Land,” “Tribal Land,” and “Private Land” rather than “Forest Service,” “Bureau of Land Management,” and so on.
- Limit text: Your map is the star—let the visuals do the talking and keep labels as concise as possible.
Every map must have every possible map element, or else it isn’t complete.
Not all map elements are required for every map—what’s essential depends on the map’s purpose, audience, and current standards in cartography.
Which map element do you think is most often overlooked, and how might its absence affect your map’s effectiveness?
- Identified the essential map elements and their purpose
- Considered how graphic design concepts impact map readability and storytelling
Visual hierarchy is a core concept in design psychology—it uses size, color, contrast, and position to subconsciously guide the viewer’s attention. Research in cartography shows that viewers typically look at the title first, then move to the main mapped area, and finally to supporting elements like the legend and credits. By thoughtfully arranging elements and adjusting their prominence, you can help users interpret your map quickly and accurately, reducing cognitive load and ensuring key messages aren’t missed.
A key or box on the map that explains the meaning of symbols, colors, and classifications used, allowing readers to decode the information presented.
A grid of latitude and longitude lines that provides a precise geographic reference and improves the professionalism of a map.
City planners often use detailed, well-designed maps to communicate zoning, transportation, and land use plans to the public. A map with clear labels, a well-placed legend, and thoughtful use of color can mean the difference between public confusion and informed community participation.
Find a map online or in print (e.g., a public transit map, weather map, or park guide). Analyze it for the presence and quality of essential map elements and design principles discussed in this lesson.
- List the map elements you see (title, legend, credits, etc.).
- Assess the map’s balance, readability, and use of color—what works well, and what could be improved?
- Note any missing elements that could help the map tell its story better.
Reflect on a time when a map either helped or hindered your understanding of information. What specific design elements contributed to that experience, and how would you redesign the map using what you’ve learned here?
Practicing cartographers often start with a “map element checklist” but adjust the layout based on the map’s audience, purpose, and output medium—whether it’s for a printed report, a poster, or an interactive web map.
What is a map legend?
Tap to revealThe map legend explains the symbols, colors, and classes used in the map, allowing readers to interpret its data.
What does the north arrow show on a map?
Tap to revealThe north arrow indicates the orientation of the map, helping users understand which direction is north.
What is a graticule used for?
Tap to revealA graticule provides a grid of latitude and longitude lines for precise geographic reference.
Which map element explains the symbols, colors, and classes used on the map?
Good design can turn complex data into an understandable story, whereas bad design can leave your audience lost and confused.
Thoughtful arrangement of essential map elements and application of graphic design principles are crucial for creating clear, effective, and visually engaging maps.
Every map should be intentionally designed with its audience and purpose in mind—there is no single “correct” layout.
How would you approach laying out a map differently if it were for an elementary school classroom versus a scientific research paper? Consider which elements and design choices you would prioritize.