Patterns are everywhere—from the flight of birds to the sprawl of cities and the path of tornadoes across a state. In GIS, unlocking these patterns transforms raw data into actionable insights that shape our world.
Think of a time you noticed a pattern in your environment—a cluster of stores, a recurring weather event, or traffic jams. What questions did that pattern raise for you?
Recognizing patterns is a key skill for every GIS user, especially an analyst. Patterns occur for a reason, even if it’s a random one. As a GIS user, you analyze patterns to determine whether they result from random, clustered, or uniform processes. After you understand the process behind the pattern, you can predict future patterns. For example, if you notice that a portion of a crop isn’t doing well, the soil might be low in nutrients—perhaps because of overplanting or underfertilization.
Knowing your geometry and patterns
Understanding the geometry and patterns in your maps helps you analyze them more effectively. Here are three basic approaches for working with patterns:
- Describe the patterns accurately so that anyone can understand them.
- Compare and contrast these patterns quantitatively with other features.
- Analyze the quantities to assess their pattern or shape and create a baseline for tracking changes over time.
Patterns in GIS aren’t just for maps—retailers, emergency responders, and even wildlife specialists depend on spatial pattern analysis for critical decisions every day.
Want to go deeper? The science behind pattern analysis in GIS
Spatial pattern analysis in GIS often uses statistical tools like the nearest neighbor statistic to measure whether points cluster, disperse, or occur randomly. These methods help remove bias and reveal meaningful trends hidden in complex data sets.
Urban planners rely on GIS pattern analysis to design effective street layouts, manage utilities, and ensure communities have access to essential services like water and power.
Recognizing, quantifying, and analyzing spatial patterns give you the power to interpret the meaning and importance of these patterns.
- Patterns can be random, clustered, or uniform—each tells a different story.
- GIS provides tools to describe, compare, and analyze these patterns quantitatively.
Military strategists, criminologists, and businesses all use GIS to analyze location-based patterns, optimizing strategies and protecting communities.
The arrangement or distribution of features (such as points, lines, or areas) across a geographic space, revealing whether they are random, clustered, or uniformly spaced.
A mathematical measure used in GIS to determine whether point features are clustered, randomly distributed, or evenly spaced.
Using GIS for the analysis
When you load spatial data into your GIS, you specify where each feature is located and how it relates to the Earth’s surface. Your GIS software then takes over, quickly calculating useful information like:
- The number of points, lines, and polygons (areas) in the dataset.
- The size of individual polygons and the total area for loaded data layer.
- The total lengths of certain line types.
When it comes to describing patterns and spatial geometry, GIS does most of the heavy lifting for you, but not all of it. You still have some decisions to make. Don’t worry, though; you have plenty of tools at your disposal. In the next sections, you’ll discover some common and powerful options.
Why is it important for a GIS analyst to make their own decisions, even with powerful automated tools at their disposal?
Determining the type of pattern
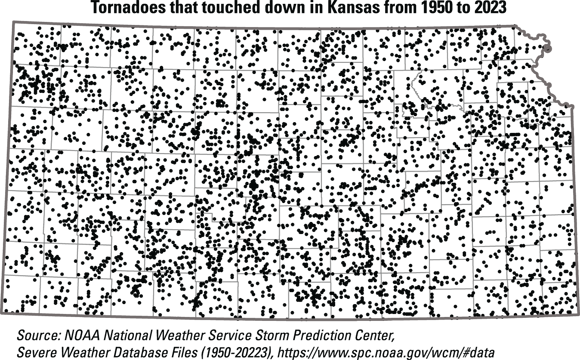
Like the twister that dropped Dorothy’s house on the Wicked Witch of the East, tornadoes in Kansas don’t follow a regular pattern. But you don’t need a wizard to figure out whether they’re clustered, random, or something else entirely. You have GIS tools—no ruby slippers necessary!
When points cluster, they tend to stick close to their neighbors, though a few may stray—like Dorothy and her friends strolling down the Yellow Brick Road. GIS uses the nearest neighbor statistic to help figure out if these points prefer hanging out together or keeping their distance.
To figure out whether a pattern is regular, random, or clustered, your GIS software follows these steps:
- It finds the random nearest neighbor distance.
Start by dividing one by twice the square root of the density of points. In the tornado example, the number of tornadoes in Kansas changes from season to season and year to year. So you need to measure the average nearest distance that would happen if the distribution were random. Use this simple equation:
 Equation for calculating the random nearest neighbor distance in a spatial dataset.
- It measures the observed nearest neighbor distance.
The GIS software measures the average distance between each point and its closest neighbor in your actual dataset.
- It calculates the ratio.
Divide the observed average nearest neighbor distance by the expected random distance. If the result is less than 1, the pattern is clustered; if it’s about 1, the pattern is random; and if it’s greater than 1, the pattern is uniform.
Practice identifying patterns with this quick exercise:
- Draw a quick sketch of 10 dots on a blank sheet of paper—try to make them look random, clustered, or evenly spaced.
- Describe your pattern: Is it more clustered, random, or uniform? What clues did you use to decide?
- Explain what process might have caused your pattern (e.g., natural forces, human planning, or chance).
How could identifying the type of pattern in a dataset help you make better decisions in your own field of interest?
Analyzing and quantifying spatial patterns with GIS transforms raw data into meaningful insights—helping you describe, compare, and predict real-world phenomena.
The nearest neighbor statistic is a powerful GIS tool for distinguishing clustered, random, and uniform patterns in spatial data.
Think about a dataset you might encounter in your studies or work. How could you use GIS pattern analysis to uncover insights or solve a problem with that data?
Patterns in geographic data are always obvious and easy to spot just by looking at a map.
Many patterns are subtle or hidden, requiring quantitative analysis and GIS tools to accurately identify and interpret them.
What does the nearest neighbor statistic measure in GIS?
Tap to revealIt measures whether point features are clustered, randomly distributed, or evenly spaced in a dataset.
Give one example of a real-world profession that relies on analyzing spatial patterns.
Tap to revealUrban planners use GIS pattern analysis to manage city growth, infrastructure, and resource allocation.
What type of pattern does a ratio of observed to expected nearest neighbor distance less than 1 indicate?
Tap to revealIt indicates a clustered pattern.
Which GIS tool helps you decide if tornado touchdowns in Kansas are clustered, random, or uniform?
How confident are you that you can use GIS tools to distinguish between clustered, random, and uniform patterns in a dataset?
The Shift
- GIS empowers you to recognize, analyze, and quantify spatial patterns for deeper understanding and better decision-making.
- The nearest neighbor statistic is a key tool for distinguishing types of spatial patterns in real-world datasets.
- Quantitative pattern analysis transforms scattered data into actionable insights, crucial for fields from urban planning to emergency response.