Recognizing Patterns
Why do patterns in maps reveal more than just where things are—and how can recognizing those patterns help you predict what comes next?
One cool thing about maps is that their symbols represent a scaled-down version of real-world geography. Cartographers arrange the features, symbols, and background elements to closely resemble the actual objects on the ground. This approach is important because patterns of geographic features often relate to an underlying process, revealing cause and effect.
That underlying process usually started in the past, continues in the present, and is likely to happen in the future. Although this continuity isn’t always the rule — because processes can speed up, slow down, or even stop — recognizing patterns helps you describe, explain, and even predict what might happen next. But first, you need to spot these patterns!
Some of the world’s most famous discoveries—from disease outbreaks to urban planning breakthroughs—began with someone recognizing a subtle map pattern that others overlooked.
When you look at a map, what patterns do you notice first? Are they obvious, or do they require a closer look?
When you identify patterns, you’re looking for predictability in how the objects are arranged. For example, if you map trees that are dying from a disease, you can predict that the nearby trees are likely to become infected as well.

Each person interprets patterns differently, depending on their experience and background. The trick to using GIS effectively is to spot patterns that might not be obvious, like clusters of trees, houses, roads, rivers, or any other feature you encounter.
Want to go deeper? The science behind spatial patterns
Spatial analysis often uses statistical methods to quantify the degree of clustering or randomness in a distribution. Tools like the nearest neighbor index or kernel density estimation help GIS practitioners move from visual pattern spotting to rigorous, data-driven conclusions.
The process of identifying predictable arrangements or relationships among features on a map.
The way physical objects or features are spaced across a geographic area.
Urban planners use pattern recognition in GIS to identify where new infrastructure—like schools or hospitals—should be built based on population clusters and transportation routes.
Think of a real-world scenario where recognizing a pattern could help solve a problem. What would you look for first?
Identifying random patterns
Patterns are based on how close together or far apart objects are from each other. Some objects, like dandelions in your yard, appear at random because of the way they spread (like in Figure 3-2). Dandelion seeds are scattered by the wind, animals, or even people, leading to varied distances between the individual plants. Some dandelions are close to each other, some are far apart, and others grow somewhere in between, producing a random distribution pattern.
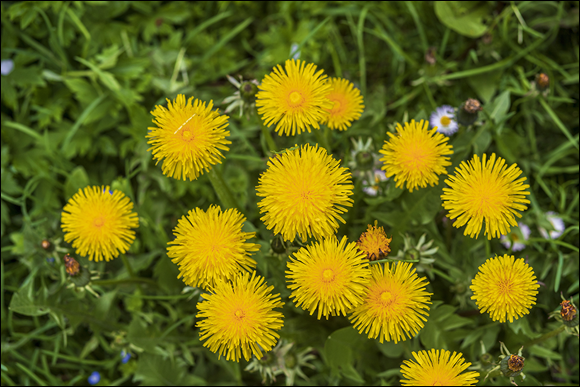
Choose an area outside (like your backyard, a park, or a street) and observe the arrangement of one type of plant or object. Are they randomly distributed?
- Draw a simple map marking the location of each object or plant.
- Describe whether the pattern appears random, clustered, or uniform—and explain why.
Finding clustered patterns
Some features naturally cluster together. For example, auto thefts often form hot spots in specific neighborhoods (as shown in Figure 3-3). These hot spots reveal underlying factors, such as the availability of high-value vehicles or easy escape routes. You might find auto thefts concentrated in areas with less surveillance or near major highways. After you start spotting spatial patterns, you begin to connect them with possible causes and effects.

Be careful when interpreting patterns. For example, maps showing clusters of tornados may simply show where more people are available to report them and not necessarily show a weather pattern. It’s important not to jump to the wrong conclusion, such as assuming that more people in an area means more tornadoes. The number of sightings is related to population, but not to the actual cause of tornadoes.
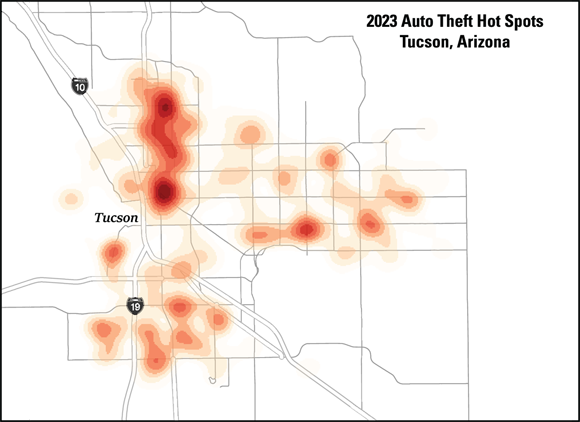
Crime analysts frequently use GIS to detect spatial clusters of incidents, which can drive targeted law enforcement and community interventions.
Observing uniform patterns
Uniform patterns are the easiest to spot. An orchard, like the one in Figure 3-4, is a classic example of a uniform distribution. Each tree is spaced practically the same distance from each other. This type of pattern rarely occurs naturally. It’s obvious that the pattern is driven by some form of human action — in this case, planting.
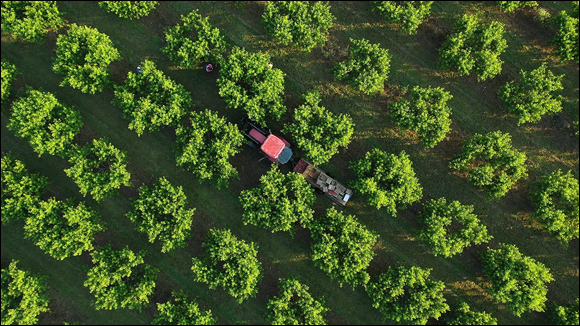
Why do you think uniform patterns rarely occur in nature? What does their presence tell you about the underlying process?
Seeing patterns among diverse features
In GIS, features sometimes show up in certain places but are missing in others. The way these features are arranged — whether by size, shape, or position — can reveal spatial relationships between different things on the map.
Clusters on a map always mean there’s a geographic or environmental cause.
Clusters can result from human reporting, population density, or random chance—not just environmental or geographic causes.
Which type of spatial distribution is most commonly a result of human activity?
Random Pattern
Tap to revealA spatial arrangement where objects show no predictable order or spacing, often resulting from natural processes like wind dispersal.
Clustered Pattern
Tap to revealA spatial arrangement where objects are grouped closely together, often due to underlying causes or shared characteristics.
Uniform Pattern
Tap to revealA spatial arrangement where objects are evenly spaced, often resulting from deliberate human action such as planting.
- You can recognize random, clustered, and uniform patterns in GIS maps.
- Patterns can provide clues about underlying processes, but interpretation requires caution.
Describe a time when spotting a pattern changed how you understood a situation—whether it was in geography, your daily life, or solving a problem. What did the pattern reveal?
Recognizing spatial patterns in GIS maps enables you to describe, explain, and predict underlying processes—transforming data into actionable insights.
Not all patterns are what they seem: careful interpretation is essential to avoid drawing false conclusions from spatial clusters.
Recognizing patterns helps you describe, explain, and even predict what might happen next.
The Shift
- Pattern recognition in GIS is fundamental for understanding geographic processes and making predictions.
- Spatial clusters, randomness, and uniformity each tell a different story about the forces shaping the map.
- Interpreting patterns wisely means questioning assumptions and looking for hidden causes behind the map’s appearance.