When working with vector data, you often need to search for specific features or patterns such as finding parks within a city, locating utility lines, or identifying nesting areas within wetlands. Vector data’s capability to represent precise locations, shapes, and connections makes it perfect for these kinds of detailed analysis. But to get meaningful results, you need to start with the right data.
Imagine being tasked with planning emergency response routes for a city. If you choose a data source with outdated or inaccurate road information, your routes could lead responders astray, costing precious time. On the other hand, selecting highly accurate and appropriately scaled road network data ensures your plan is reliable and actionable.
Some GIS datasets are updated daily, while others may be decades old. The freshness of your data can impact everything from flood risk analysis to conservation planning.
Choosing the Right Data Source
Choosing the right data source is like picking the right tool for the job. Each data source brings its own strengths, and selecting the wrong one can lead to frustrating roadblocks or inaccurate results. By considering factors like data type, scale, accuracy, and precision, you set yourself up for success, ensuring that your searches yield meaningful insights and align with your project goals.
Targeting the right data
Your project goals drive which vector data is best for you to search. Different projects call for different types of data, and targeting the right data keeps your searches on track and your results meaningful.
For example, if you’re analyzing flood risks, hydrography data with medium-scale detail is ideal for identifying rivers and streams. But if you’re planning wildfire response strategies, high-accuracy road-network data is essential to route emergency vehicles quickly and safely.
Keep the following four key factors in mind when choosing your data sources:
-
Data Type: Identify what kind of information — points, lines, or polygons — you’re working with. Each data type has strengths for different kinds of analysis, so you want to base your choice on what your project needs most:
- Points depict specific locations, like fire hydrants and wells.
- Lines connect features, like roads and rivers.
- Polygons represent areas, like parks and lakes.
- Scale: Determine how “zoomed in” you need to be. Scale is about the level of detail in your dataset. For example, state-wide data (small scale, less detail) won’t show the individual buildings and parcels that you’d find in neighborhood-level data (large scale, more detail).
- Accuracy: Estimate how close your data’s locations and measurements are to the real world. For example, a trailhead mapped at an accuracy of ten feet might be close enough for a hiking app but too vague for land surveying. Choose data with accuracy that matches your project’s needs.
- Precision: Be aware of how much detail you need. Precision refers to the level of detail in the data, such as the number of decimal places. High precision gives consistent, specific values but doesn’t guarantee accuracy. You can have coordinates with six decimal places that are consistently off by 100 feet — which is highly precise but not very accurate.
What could happen if you choose a dataset with poor accuracy for a project that requires pinpoint locations?

It’s easy to confuse accuracy and precision. Think of it this way: Accuracy is telling the truth; precision is telling the same story the same way over and over. Just because your data is precise doesn’t mean that it’s accurate, and just because it’s accurate doesn’t mean that it’s precise. In GIS, high-precision coordinates or measurements that aren’t accurate will still miss the mark if they’re off from the real location.
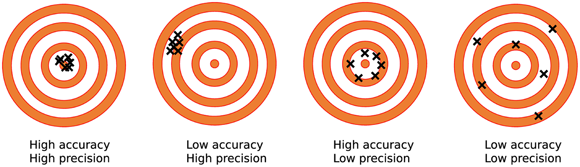
High precision always means high accuracy in GIS data.
You can have very precise data that’s consistently off from reality—precision and accuracy are separate qualities.
How would your approach change if your project required high precision but only moderate accuracy?
Scale determines the level of detail and geographic coverage in your dataset. Large-scale data (such as neighborhood maps) gives you very detailed information, while small-scale data (such as state or country maps) provides a broader overview but less detail. Choosing the wrong scale can mean missing key features or including too much unnecessary information. Think critically about your project’s spatial scope before picking your dataset.
- Learned how vector data types impact GIS analysis
- Explored the importance of scale, accuracy, and precision in choosing data sources
Emergency planners use high-accuracy, moderate-precision datasets to map hospitals and fire stations, ensuring responders reach the right locations quickly—even if every centimeter isn’t mapped.
The degree to which data matches the true location or measurement in the real world.
The consistency of repeated measurements or the level of detail (such as decimal places) in GIS data.
Whether you’re monitoring wildlife migration corridors, planning public infrastructure, or managing conservation efforts, selecting the right data can make all the difference in achieving accurate, actionable results.
GIS practitioners often balance data accuracy and precision depending on the project’s needs—for some tasks, like land parcel mapping, both qualities are essential, while for others, moderate accuracy suffices.
Think of a real-world scenario where data type (points, lines, polygons) would change the outcome of your GIS analysis. What are the consequences?
TABLE 9-1 Sample Data Use Cases
| Use Case | Ideal Data Type | Rationale for This Data Type |
|---|---|---|
| Emergency response planning | Points (emergency services); small scale; high accuracy and moderate precision | Pinpointing locations with high accuracy ensures that hospitals and fire stations are correctly mapped for emergency response; moderate precision is sufficient because responders need general locations rather than exact, centimeter-level details. |
| Transportation analysis | Lines (roads and streets); medium scale; moderate accuracy and precision | Road networks show connectivity essential for routing and infrastructure planning. High accuracy and precision are crucial for building roads, but moderate accuracy and precision are sufficient for planning and analysis, for which general alignment and connectivity matter more than exact placement. |
| Land development studies | Polygons (property boundaries and parcels); large scale; high accuracy and precision | High accuracy and precision ensure that property boundaries and parcels are correctly mapped for zoning, legal boundaries, and property development planning, for which exact placement is critical for decision-making. |
Match a GIS project goal to the most appropriate data type, scale, accuracy, and precision.
- Pick a project scenario (e.g., mapping wildfire evacuation routes).
- Identify which data type (points, lines, polygons), scale, accuracy, and precision would best serve the project.
- Explain your rationale for each choice.
What is the main difference between accuracy and precision?
Tap to revealAccuracy measures how close data is to the true value, while precision measures how consistently data can be repeated.
Which vector data type is best for representing locations like fire hydrants?
Tap to revealPoints are best for representing specific locations such as fire hydrants.
What does scale determine in GIS data?
Tap to revealScale determines the level of detail and geographic coverage in a dataset.
Which factor describes how close GIS data is to actual real-world locations?
Reflect on a time when the wrong data source led to confusion or mistakes in a project, or imagine how accuracy and precision could impact a GIS analysis you might do. How would you approach data selection differently based on what you’ve learned?
Choosing the right data source—by evaluating data type, scale, accuracy, and precision—is crucial for meaningful and reliable GIS analysis.
Accuracy and precision are distinct qualities; both must be considered to avoid errors and achieve actionable GIS results.