Identifying and Locating Features in Raster Data
How can we uncover meaningful geographic features hidden within millions of pixels in raster data?
When analyzing raster data in GIS, you’re working with a pixel-based view of the world, in which each pixel holds valuable information about the landscape below. Imagine each pixel as a tiny data point representing features that may span miles, like a dense forest or flowing river, or more specific locations such as a park or landmark. Raster data allows you to explore huge areas, but finding and identifying specific features requires you to take a deeper look at what’s hidden in each pixel.
Digital Elevation Models (DEMs) are widely used in environmental studies, urban planning, and even disaster response to quickly identify critical terrain features.
In this lesson, you’ll explore practical techniques for locating and analyzing different types of features in raster data — whether you’re searching for a point of interest, tracing linear features like roads and rivers, or analyzing large regions with unique characteristics. Each type of feature has its own quirks and may require a unique approach. Mastering these quirks will help you unlock the full potential of your raster data, supporting smarter decisions, better planning, and powerful geospatial analyses.
What kinds of questions could raster data help answer about the areas where you live, work, or play?
Locating Areas of Interest
One of the cool things about raster data is that it’s like a treasure map, with each pixel holding clues about the landscape. Your “treasure” might be finding the highest peaks in a mountain range or pinpointing valleys and lowlands for a flood-risk study. In cases like these, a digital elevation model (DEM) — a special raster layer that provides elevation — is your go-to raster. For example, a DEM of a small mountain range can highlight areas above 7,000 feet, revealing snowpack regions important for water supply or identifying prime spots for outdoor adventure.
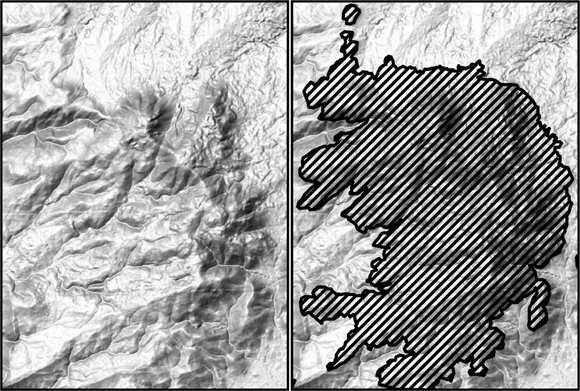
Environmental scientists often use elevation thresholds in DEMs to quickly identify potential habitats or high-risk flood zones, saving hours of manual scanning.
- Recognized the role of DEMs in highlighting key terrain features.
- Learned that raster layers can represent anything from elevation to vegetation and temperature.
To locate areas of interest in raster data, follow these steps:
-
Choose the right raster layer.
Start by figuring out which layer has the data you need. For elevation analysis, that’s your DEM layer. If you were studying vegetation, you would probably use a land cover layer; for urban heat island studies, a temperature raster layer would be best.
-
Define your target values.
Decide what values you want to look for in the data. For elevation, you might set a threshold of 7,000 feet. You can use GIS to flag any pixels over that value as your high points.
-
Run a spatial query.
Use a spatial query tool in your GIS software to search for pixels that match your target values or fall within your determined range. In QGIS, you can use the Raster Calculator. In ArcGIS Pro, you might use the Raster Calculator or the conditional evaluation (Con) tool. These tools isolate pixels that meet your criteria.
-
Check and save your results.
Review the identified areas to ensure they make sense for your project. You can save these as a new layer for further analysis or visualization.
A raster layer where each pixel’s value represents elevation above sea level, enabling terrain and watershed analysis.
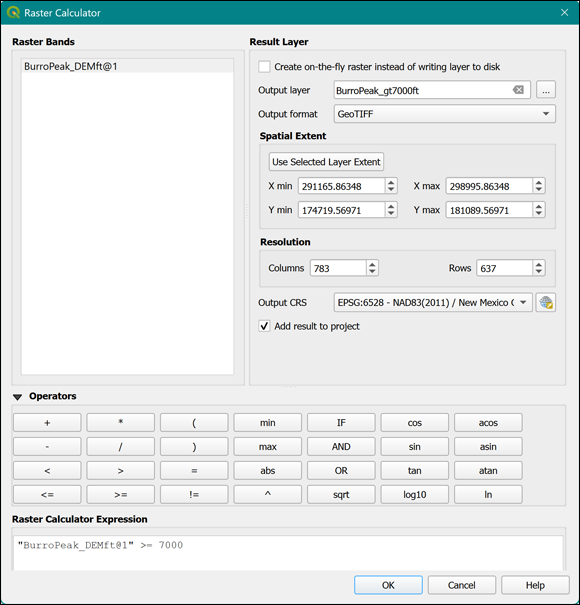

Running spatial queries doesn’t just help you find areas of interest but can also help you visualize patterns in your data. By identifying peaks, valleys, or vegetation types, you reveal the hidden treasure — the “story” of the landscape and how these features are arranged across the area.
Let’s practice identifying high elevation zones in a DEM:
- Open a DEM raster layer in your GIS software.
- Use the Raster Calculator to create an expression that highlights all pixels above your chosen elevation (e.g., 7,000 feet).
- Review the output. Which areas are highlighted? Are they what you expected?
A process in GIS for searching and selecting pixels or features that meet specific location or attribute criteria within a dataset.
Why do you think it’s important to check your results after running a spatial query?
Want to go deeper? The science behind spatial queries
Spatial queries are powered by logical expressions that compare pixel values to your chosen criteria. Under the hood, GIS software evaluates these expressions across every pixel, producing a new raster where only the matching pixels are highlighted. Efficiency can vary: some queries run in seconds on small datasets, while massive rasters may require more computing power or specialized techniques.
City planners use spatial queries on land cover rasters to identify suitable locations for parks, schools, or emergency services — quickly narrowing down vast areas to just the right spots.
What other types of raster data besides elevation might be useful for identifying features in your field of interest?
Describe a scenario in which identifying a specific area (like high elevation or dense vegetation) using raster data could make a real-world impact. What steps would you take, and what challenges might you face?
“By identifying peaks, valleys, or vegetation types, you reveal the hidden treasure — the ‘story’ of the landscape and how these features are arranged across the area.”
Raster data is just a collection of images and can’t provide precise geographic information.
Each pixel in raster data is packed with geographic information, enabling detailed spatial analysis and feature identification — far more than just a visual image.
What is the primary purpose of using the Raster Calculator tool in GIS when analyzing DEMs?
What does each pixel represent in a DEM raster?
Tap to revealEach pixel in a DEM represents the elevation above sea level at that location.
What is a spatial query in GIS?
Tap to revealA spatial query selects pixels or features in a dataset based on their location or attribute values.
Why is it important to save your query results as a new layer?
Tap to revealSaving results as a new layer allows you to further analyze or visualize the specific areas of interest without altering your original data.
Raster data analysis unlocks powerful insights about the landscape by allowing you to identify, locate, and analyze features through pixel-level queries and specialized tools like the Raster Calculator.
Choosing the right raster layer and carefully defining your criteria are essential steps for meaningful geographic analysis in GIS.
How might the process of identifying features differ when working with raster data versus vector data in GIS?
The Shift
- Raster data is more than just imagery — each pixel encodes valuable geographic information that can be queried and analyzed.
- Tools like the Raster Calculator empower users to quickly locate and examine specific features, such as high elevations or unique land cover types.
- Careful selection of raster layers and thoughtful definition of criteria are critical to successful geospatial analysis and decision-making.