How do computers turn paper maps and real-world geography into precise digital data you can analyze, visualize, and share?
GIS empowers you to digitally map and analyze your study area, but before you dive in, you must decide how your map’s features—points, lines, areas, and surfaces—will be represented and understood by your computer.
Digital maps can reveal patterns, trends, and relationships nearly impossible to spot on paper maps—making GIS essential for everything from urban planning to environmental monitoring.
Deciding How to Represent Your Data
GIS uses two primary approaches for storing and displaying spatial data: raster (pixels or grid cells) and vector (points, lines, and polygons). Both have strengths and limitations, but most GIS software supports both—so you don’t need to worry about choosing one forever.
Which types of features—points, lines, areas, or surfaces—are most important in your mapping project, and why?
Picking a Raster-Based Model
Imagine a raster data model as a grid of tiny squares, like a checkerboard. Each cell covers a piece of the landscape and can represent a specific feature. Here’s how raster models handle different features:
- Points: Points in raster data are represented by single grid cells. For example, a fire-lookout tower becomes one colored square. Raster points are simplified, but still signify crucial locations like water wells or city landmarks.
- Lines: Lines appear as connected strings of grid cells that trace their central path. For wide features, you can group adjacent cells. Narrow rivers or highways might use a single row of cells, while wider ones use clusters.
- Areas (Polygons): Areas, or polygons, use multiple adjoining cells—each assigned a value, such as forest, agriculture, or water. Crop areas become blocks of cells.
- Surfaces (Volumes): Surfaces represent 3D features like elevation or groundwater depth. Each cell stores a value (such as height), enabling detailed analysis. Digital Elevation Models (DEMs) are a classic raster dataset, visualized as shaded grids to show valleys and peaks.
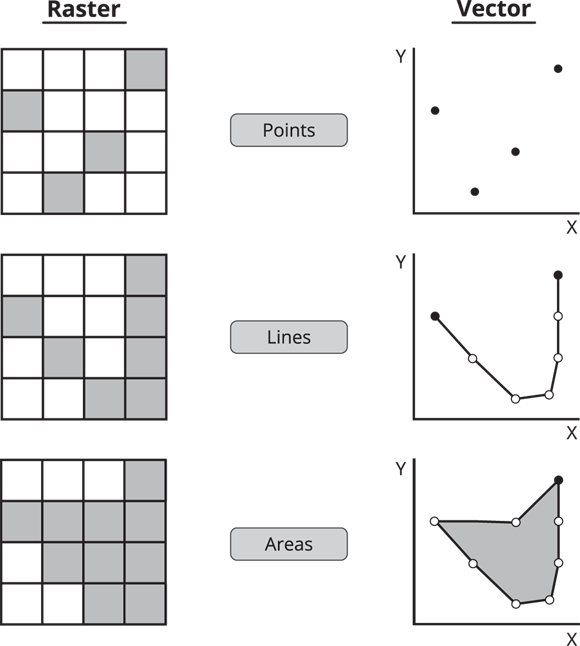

Raster data represent a point with a single grid cell, a line with a line of grid cells, an area with a group of grid cells, and a surface with groups of grid cells that have unique values.
Choosing a Vector-Based Model
Unlike raster, vector models use precise coordinates to represent features. They’re ideal for capturing exact locations and boundaries. Here’s how vectors handle each feature type:
- Points: Each point is mapped by a single X and Y coordinate, like a pin on a map. No length, width, or area—just a precise location.
- Lines: Lines connect two or more points to represent features like roads, rivers, or pipelines. Vectors can capture curves and straight paths with high precision. If a feature’s width matters, extra attributes or polygons can store this detail.
- Areas (Polygons): Polygons are closed shapes formed by connecting three or more points. Examples include lakes, city boundaries, or parcels of land. The start and end points meet to form a closed boundary.
A spatial data representation where features are stored as a grid of cells, each with its own value.
A spatial data representation using exact coordinates to define points, lines, and polygons.
What advantages might vector models offer over raster models when mapping city infrastructure?
Want to go deeper? The science behind raster versus vector models
Raster models are best for continuous data—like temperature, elevation, or rainfall—where every location has a value, and changes are gradual. Vector models excel at representing discrete boundaries—such as property lines or roads—with precision. Some GIS projects use both: a raster base map for terrain, and vector overlays for landmarks and infrastructure. Understanding when to use each model is key to effective digital mapping.
Urban planners use vector data to design transportation networks, while environmental scientists rely on raster datasets to analyze vegetation and terrain changes from satellite imagery.
Examine a digital map (Google Maps or similar) and choose three features. Decide whether each is best represented as raster or vector:
- Pick one landmark, one road, and one land area (e.g., park or lake).
- For each, note whether it is better suited for raster or vector representation, and explain why.
Many GIS professionals convert paper maps into digital formats by carefully digitizing features using specialized software—ensuring accuracy, consistency, and seamless integration with other spatial data.
- Raster models use grids of cells to represent spatial features.
- Vector models use precise coordinates for points, lines, and polygons.
- Each data model has strengths for different mapping tasks.
Digital maps always use pixels and grids, just like images or photos.
GIS maps can use either raster (grids) or vector (coordinates) models, depending on the data and purpose.
“Your computer isn’t as smart as you are when it comes to understanding the data.”
Imagine you’re digitizing a hand-drawn map of your neighborhood. Which features would be challenging to represent accurately using a raster model, and why?
What is a raster data model in GIS?
Tap to revealA spatial data model that represents features as a grid of cells, each with its own value.
How does a vector model represent a line?
Tap to revealAs a series of connected points (X,Y coordinates), allowing for precise curves and boundaries.
What is a Digital Elevation Model (DEM)?
Tap to revealA raster dataset where each cell contains an elevation value, used to analyze terrain features.
Think about a real-world GIS project you’d like to undertake. How would you decide whether to use raster, vector, or both models for your data, and what challenges might you face during the conversion process?
Which GIS data model would best represent continuous phenomena like elevation or rainfall?
Choosing between raster and vector models is essential for converting maps into digital formats, as each model offers unique strengths depending on your GIS project’s goals.
Raster models excel at representing continuous surfaces and gradual changes, while vector models are best for precise locations and boundaries.
How confident are you that you can explain the difference between raster and vector models in GIS?
The Shift
- GIS data can be represented in raster or vector formats, each suitable for specific mapping tasks.
- Understanding the strengths of raster and vector models helps you make informed choices when digitizing maps.
- Converting maps into digital formats is the foundation for accurate, powerful spatial analysis in GIS.