Think of vector data as digital building blocks of the world, like the points, lines, and polygons that you would draw manually on a map. Each point has X and Y coordinates, with lines connecting these points in sequence and polygons looping around and ending where they started.
Many smartphone map apps rely on vector data models to provide smooth, interactive, and customizable maps—enabling features like turn-by-turn directions and searching for businesses nearby.
But vector data doesn’t stop with simple points, lines, and polygons. How does a road “know” it connects to another road? Or how does one town boundary “know” it neighbors another? This section explores how GIS turns these simple shapes into intelligent, interactive maps that understand how the world fits together.
Pause and consider: Why do you think it’s important for a map to know not just where features are, but also how they relate to one another?
Moving beyond a simple model
The spaghetti model is one of the earliest models used in GIS for handling vector data. In the early days of GIS, this model provided a quick and easy way to store points, lines, and polygons independently. It earned its name because the data structure resembles a tangled pile of noodles on a plate — (although not smothered with red sauce and meatballs). In the spaghetti model, each feature stands alone, with no awareness of other features around it, as shown on the left in Figure 5-5. Although the model was great for input and output, it quickly became impractical for today’s complex datasets in which relationships between features matter.
All digital maps are made up of features that automatically know how they connect or interact with each other.
Early models like the spaghetti model stored features independently, without any awareness of how they relate, which limited analysis and accuracy.
Today, spaghetti models have largely fallen out of use. Instead, modern GIS relies on topological models (explained in the next section) because they store spatial relationships. In these models, your GIS software understands which polygons share borders, which streets connect at intersections, and how areas nest within one another, thereby making analysis far more powerful and accurate.
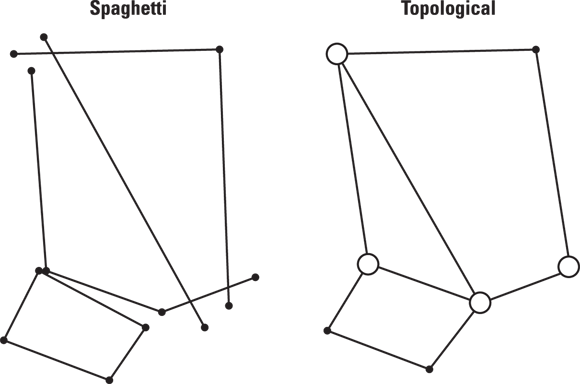
An early vector data model where map features (points, lines, polygons) are stored independently, without knowledge of their spatial relationships.
A vector data model that records how features connect or relate—enabling GIS to understand relationships like connectivity, adjacency, and containment.
Think about a city map: What problems might arise if the map didn’t know where roads intersect or which neighborhoods share a border?
- Vector data uses points, lines, and polygons to represent features on a map.
- The spaghetti model stores features independently, which limits spatial analysis.
Adding spatial smarts to GIS with topology
Topology is a branch of mathematics that describes how features (geometric objects) connect — or don’t. GIS uses topology to define and enforce spatial relationships, ensuring that features align and connect correctly in the database. Topology is the secret behind GIS’s ability to recognize shared boundaries between polygons or connections at street intersections. Just as your mind uses spatial reasoning (your sense of space) to understand that the coffee shop is next to the grocery store, topology gives GIS a set of rules that explicitly define these relationships — making spatial analysis more accurate and producing more reliable results.
In the real world, features interact, meaning that rivers flow along county boundaries and roads meet at intersections. GIS needs topology to understand these relationships and prevent errors such as the following:
- Roads don’t connect where they should.
- Gaps exist between property boundaries.
- Polygons overlap when they shouldn’t.

When topology is included in the data, GIS can quickly validate and analyze spatial relationships. Validation and analysis are especially important for tasks like network analysis (finding the shortest route to the coffee shop) or property management (making sure that parcels align correctly).
Why might it be risky to use GIS data that doesn’t enforce topological rules for important projects like city planning or utility management?
To grasp the power of topology, it’s useful to think about its three fundamental components:
- Connectivity: Connectivity ensures that lines meet where they should, such as intersections. In GIS, the connectivity component enables the software to understand where roads, pipelines, or transit routes connect. For example, when you use GIS to find the shortest route through a city, you rely on connectivity to determine which streets link at intersections and which ones don’t. Connectivity keeps you from accidentally routing through a dead end or across an impassable barrier.
- Adjacency: Adjacency (sometimes called contiguity) refers to the relationship between features that share a boundary. For example, two neighboring land parcels are adjacent because they share a common border. If you’ve ever looked for a house next to a park, you’ve relied on adjacency. The concept of adjacency is a crucial task for land-use planning, wildlife habitat connectivity, and any analysis that depends on knowing what’s next to what.
- Containment: Containment (also known as area definition) ensures that boundaries connect to create closed shapes, forming polygons. With well-defined polygons, GIS can calculate metrics like area size or perimeter. This capability is important for assessing how much space a city park covers within the city’s boundaries or determining the total area of a lake inside a watershed boundary.
Want to go deeper? The science behind topology in GIS
Topology in GIS borrows from mathematical graph theory, where nodes, edges, and faces represent real-world analogues like intersections, roads, and land parcels. Topological structures allow GIS to perform complex spatial queries, such as identifying all regions adjacent to a certain feature or tracing a network path without manual intervention. This approach dramatically improves data integrity and enables sophisticated analyses, from route optimization to error detection in large-scale mapping projects.
Look at a simple map (printed or digital) of your neighborhood or campus. Try to identify:
- Find two roads that should intersect. Do they connect on the map?
- Look for property or land boundaries. Are there any gaps or overlaps?
- Check if any areas (parks, lakes) are completely enclosed within boundaries.

Many modern GIS systems enforce topological rules through advanced data models, like geodatabases and PostGIS-enabled spatial databases. These systems help users automatically validate and clean data, making analysis smoother and more reliable. For example, geodatabases ensure that features like water pipes connect only at valid points (called nodes), which reduces errors in utility networks. PostGIS adds spatial capabilities to PostgreSQL, enabling powerful queries based on spatial relationships like “adjacent to” or “within.”
City planners use topological GIS data to ensure that new roads properly connect with existing streets, helping prevent dead ends and improving emergency response times.
Topology transforms simple vector shapes into intelligent maps by making spatial relationships—like connectivity, adjacency, and containment—explicit and enforceable in GIS.
Topology is the secret behind GIS’s ability to recognize shared boundaries between polygons or connections at street intersections.
Without topological rules, even the most detailed digital maps can fail at real-world tasks like route finding, property management, and utility mapping.
Practitioners often spend significant time validating topological relationships before any major analysis or decision-making, because even small errors can ripple through a project and lead to costly mistakes.
Imagine you’re designing a GIS map for a new city park. What spatial relationships would you need to ensure are accurate, and why? Reflect on how topology would help prevent future issues.
What is the spaghetti model?
Tap to revealAn early GIS vector data model where features are stored independently, without knowledge of spatial relationships.
Define topology in the context of GIS.
Tap to revealThe set of rules and relationships describing how vector features connect and relate, enabling accurate spatial analysis.
What is connectivity in GIS topology?
Tap to revealThe property that ensures lines (like roads or pipes) meet or link at specific points, such as intersections or nodes.
Give an example of adjacency in GIS.
Tap to revealTwo land parcels that share a common border are adjacent in GIS terms.
Which of the following is NOT a benefit of using topological vector models in GIS?
Describe a real-world scenario where failing to use topology in GIS could create serious problems. What errors might result?
How confident are you that you can explain the difference between the spaghetti and topological vector models in GIS?