Examining Raster Models and Structure
Why do GIS experts use raster grids to represent the complex, flowing shapes of Earth’s landscape—and what do we gain or lose when everything becomes a square?
Imagine looking at a checkerboard—but instead of playing pieces, each square tells you something about a patch of the real world: a road, a tree, a river. Raster models take this simple grid and use it to map, analyze, and manage the wild complexity of geographic data.
Satellite imagery, weather maps, and digital elevation models—some of the most widely used GIS datasets—are all based on raster grids. This makes raster models a backbone of modern geospatial analysis.
Raster data models consist of a grid of cells, like a checkerboard. Instead of black and red squares with a round checker piece in it, however, each square in a data model represents a tiny unit of geographic space. On a raster “game board,” GIS assigns every square, or cell, a value. These cells represent different geographic features such as roads, rivers, houses, or parks.
With checkers on a checkerboard, you can move the pieces around, but only in specific ways based on the game’s rules. Similarly, raster grids follow rules about what can be where. Each square, or cell, in the grid has limits on what it represents, whether it’s land, water, roads, or other features. Geographic space in a raster is divided into small, manageable cells, but each one must follow the “rules” of what it can depict.
The real world isn’t divided into neat little squares as a checkerboard is. Geographic features like rivers, forests, and roads flow and overlap in irregular ways. A raster grid simplifies the complexity of dividing the Earth’s surface into uniform cells, with each representing a specific value for that part of the landscape. However, this simplification comes with a trade-off: Although it makes analyzing geographic data easier, it also reduces detail. Small features may get “averaged out,” and the shapes of natural features can look blocky or less precise. Figure 5-1 shows how this simplification works. The grid overlays the landscape, providing a way to analyze geographic patterns but with some loss of finer details.
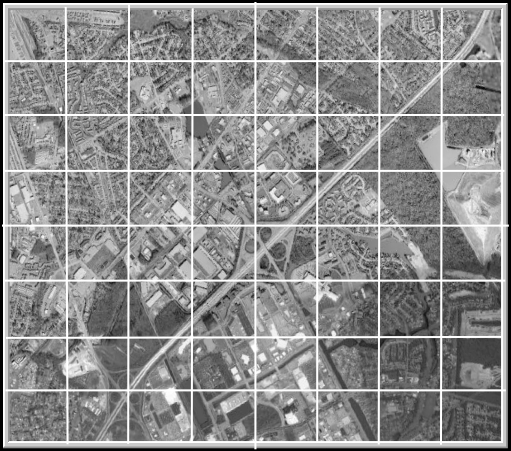
How might simplifying complex landscapes into squares help and hinder our understanding of geographic data?
Representing dimension when everything is square
As mentioned earlier, raster models work like a checkerboard grid in that they consist entirely of squares. Every square, or grid cell, contains a piece of Earth’s surface data. But the real world isn’t made up of squares; it’s a more complex arrangement of points, lines, areas, and even 3D surfaces (also called volumes).
When it comes to surfaces, things get a bit tricky because surfaces introduce a third dimension, like height or depth. You can dive into the third dimension in the section “Dealing with Surfaces,” later in this module.
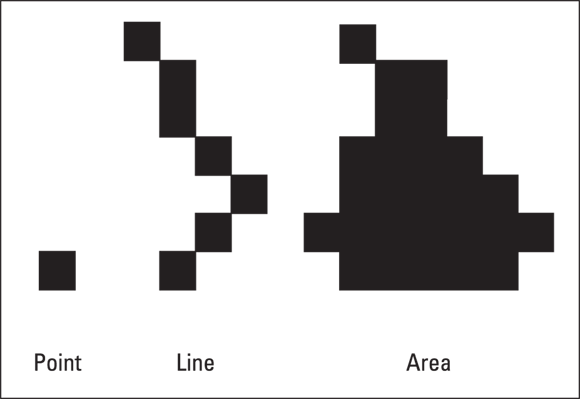
For now, the following list describes how points, lines, and areas fit into a raster grid system (as shown in Figure 5-2):
- Points: In the real world, a point represents a specific location, like a tree or well. A point is considered zero-dimensional because it doesn’t take up space. In a raster model, even this tiny location takes up one full grid cell.
- Lines: A line is a one-dimensional object that represents a feature like a road or river. In a raster model, a line appears as a string of connected grid cells tracing the line’s path.
- Areas (Polygons): An area, such as a park or lake, is a two-dimensional object. An area covers more ground and is represented by a group of connected grid cells that form its shape.
GIS professionals often use raster models for environmental monitoring, disaster response, and urban planning because they make it easy to run calculations over large areas—like measuring flood zones or mapping vegetation.
What are some real-world features that might not fit neatly into a grid cell—how does GIS handle them?

Raster models make points, lines, and areas fit into grid cells: Points take up a single cell, lines are strings of cells, and areas are groups of cells. See the module on grid representations for more details on how grids capture geographic features.
Making a quality difference with resolution
At first glance, using two-dimensional squares (raster grid cells) to represent points or lines may not seem to make sense. How does one little tree fit into a big square? Well, it doesn’t really, but raster cells simplify the data, helping your GIS store information about that one little tree in a structured and efficient way.
This simplification comes with trade-offs. Raster models divide space into a grid of uniform cells, and every feature within a cell — whether that feature is a single tree or an entire building — is represented by a single value. This means that some spatial detail and precision are lost, especially for points and lines. But in exchange, raster models provide an efficient and powerful way to store, analyze, and model geographic data.
When you work with raster data, one of the most important decisions you make is the choice of grid cell resolution, which is the size of each cell in real-world units (such as meters or feet). Smaller grid cells provide greater detail, a lot like how a high-definition TV screen has more pixels to create a sharper image. A raster with 1-meter resolution, for example, captures finer details than a raster with 30-meter resolution because each 1-meter cell represents a much smaller area.
A single square unit in a raster grid that represents a specific portion of geographic space, assigned a value by GIS.
The size of each grid cell in a raster model, which determines the level of detail in representing geographic features.
Want to go deeper? The science behind raster simplification
Raster models work by averaging or aggregating real-world information into uniform cells. This process is called spatial quantization, and it’s essential for running complex calculations quickly. However, scientists and GIS specialists must always balance detail with storage and processing power—the smaller the cells, the more data and computational resources required.
- Raster models use grids of cells to represent geographic space.
- Points, lines, and areas are all fit into square cells, but some detail is lost.
Flood risk maps, land cover classification, and urban heat island studies all rely on raster models to analyze and visualize sprawling areas with complex features.
Draw a simple landscape (houses, roads, trees) on a sheet of paper. Now overlay a grid on top and try to assign one value to each square. Compare how your detailed drawing changes when you must “average” each cell.
- Sketch a landscape with at least three different features.
- Draw a grid overlay and fill each cell with only one feature type.
- Reflect: Which features were hardest to fit into a cell? What details were lost?
How would you decide on the best cell size (resolution) for a raster model if you were mapping a city park? What factors would influence your choice?
Think about a scenario where raster grids might not be the right tool—when would another GIS model be better?
Raster grids can capture every detail of a landscape, just like a photograph.
Raster models simplify the landscape into squares, which means some details are lost or averaged out—especially small or irregular features.
What is a raster cell?
Tap to revealA square unit in a raster grid that holds a value representing a tiny area of the landscape.
What does “resolution” mean in raster models?
Tap to revealThe size of each grid cell, determining the level of detail in the raster data.
How does a raster model represent a line feature like a road?
Tap to revealAs a string of connected grid cells tracing the road’s path across the raster grid.
What is the main trade-off when using raster models to represent geographic features?
The real world isn’t divided into neat little squares as a checkerboard is. Geographic features like rivers, forests, and roads flow and overlap in irregular ways.
Raster models transform complex landscapes into a grid of cells, allowing powerful analysis but at the cost of some detail and precision.
The resolution you choose for a raster grid directly impacts how much detail is captured—and what might get lost.
The Shift
- Raster grids simplify geographic space into uniform cells, enabling efficient data analysis.
- Points, lines, and areas are all represented within raster cells, but small features can be lost or distorted.
- Choosing the right resolution is critical for balancing detail and practicality in GIS projects.