Picture hiking up a mountain. You see the trail on your map, but what about the steep climbs and sudden drops? That’s the challenge of representing real-world surfaces—and why GIS surface modeling is so crucial for anyone working with digital geography.
Imagine planning a new hiking trail, a road, or analyzing where water will flow after a heavy rain. Without understanding the ups, downs, and subtle shifts of terrain, even the best plans can fall apart. GIS surface models bring landscapes to life, so you can make smarter decisions with the full picture in mind.
NASA uses digital elevation models from satellites to map the surfaces of planets like Mars and the Moon, not just Earth!
How GIS Models Surfaces
GIS data models do more than store points, lines, and polygons; they also represent elevation and terrain. When you need to analyze the shape of the land, GIS represents surfaces using either raster grids or vector-based structures. If you checked out earlier modules on raster and vector models, you already know that rasters store data in a grid, whereas vectors use points and lines to define features. The same principles apply to surface models: raster-based surface models, like Digital Elevation Models (DEMs), store elevation values in a grid, whereas vector-based surface models, like Triangulated Irregular Networks (TINs), use connected triangles to represent changes in terrain. These surface models help with everything from mapping hills to analyzing slopes and water flow.
What types of real-world decisions could benefit from knowing the shape and elevation of the land?
Imagine that you’re hiking up a mountain. Getting to the top is not just about following a trail marked on a flat map; you also need to know the ups and downs of the terrain. That’s where surface modeling in GIS comes in. It adds that third dimension, giving you a full picture of the landscape, bumps and all!
Want to go deeper? The science behind surface models
Surface models allow GIS users to analyze phenomena like water flow, landslide risks, and solar exposure by incorporating elevation data. Advanced hydrological models, for example, rely on surface data to predict how water will move across a landscape, which is critical for flood planning and resource management.
Storing Surface Data in a Raster Model
The raster data model is one of the easiest ways to store surface data. Each grid cell represents not only an area on the Earth’s surface but also a single elevation value. So a cell located at column X and row Y stores an elevation value (Z) for that specific area.
Why might a simple grid be both an advantage and a limitation when modeling terrain?
- Limited accuracy: Each grid cell stores only a single value for the whole area it covers, which can reduce precision.
- Coarser detail with larger cells: As grid cells get larger, you lose detail, making it harder to capture fine features in the terrain.
On the plus side, raster surfaces require less computational power, making them efficient and great for large-scale surface modeling. They’re also easy to convert into other formats, like contour lines or topographic data.
A raster-based surface model where each cell contains an elevation value, allowing for the creation of 3D terrain, slope, and hydrological maps.
A grid-based way to represent surfaces in GIS, with each cell storing one value (such as elevation) for its area.

DEMs come in several sizes, depending on the maps they were derived from. USGS DEMs are available in:
- 7.5-minute DEMs (covering 7.5 minutes of latitude by 7.5 minutes of longitude): These provide the highest level of detail and are commonly used for detailed terrain analysis.
- 15-minute, 30-minute, and 1-degree DEMs: As the area covered increases, both horizontal and vertical accuracy decrease.
Smaller intervals like the 7.5-minute DEM are best for detailed studies, whereas coarser intervals like the 1-degree DEM are better suited for regional or broad-scale analysis.

You can download DEMs directly from the USGS website or purchase enhanced versions from commercial vendors. Most modern GIS software supports DEMs and can convert them into different formats, such as:
- Raster grids for terrain modeling
- Contour lines to show elevation changes
- Vector topographic data for detailed mapping
This flexibility makes DEMs an essential tool for both terrain analysis and visualization.
Engineering firms use DEMs to plan highway routes, ensuring that new roads don’t cross areas prone to landslides or flooding.
All surface models in GIS are highly detailed, no matter the format or cell size.
Surface model detail depends on the data source and cell size—larger cells in raster models mean less detail.
- GIS can represent terrain using both raster and vector models.
- Raster surface models like DEMs are efficient and easy to use, but lose detail as cell size increases.
Representing Surfaces in a Vector Model
Vector-based surface models are more complex but offer higher precision. The most common vector surface model is the Triangulated Irregular Network (TIN). Think of a TIN as a surface made up of a bunch of connected triangles. These triangles represent flat parts of the terrain, and by connecting them edge to edge, the model creates a continuous surface.
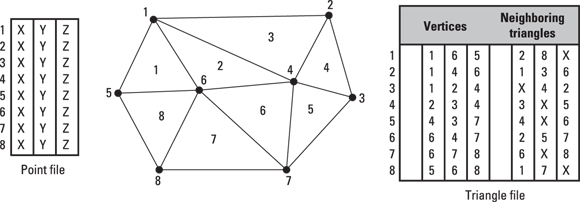
When might you need the precision of a vector surface model instead of a raster DEM?
The TIN model breaks surfaces down into three components:
- Triangulated: You form each triangle using three points with known X, Y, and Z values.
- Irregular: The triangles vary in shape and size to match the terrain’s complexity.
- Network: The triangles connect along their edges to form a seamless surface (known as a facet).

Each triangle’s slope and direction (aspect) remains consistent within the triangle, which makes TINs ideal for capturing small, detailed variations in terrain. In the real world, engineers often use TINs when planning where to build roads or tunnels in order to model the steepness of slopes very accurately.
Surveyors and GIS professionals use TINs to design large construction projects where the exact shape of the land impacts budgets and safety.
Raster and vector surface models each have strengths: rasters (like DEMs) are efficient for large areas, while vectors (like TINs) capture fine terrain details crucial for engineering and analysis.
Surface modeling in GIS adds that third dimension, giving you a full picture of the landscape, bumps and all!
What is a Digital Elevation Model (DEM)?
Tap to revealA raster-based grid where each cell contains an elevation value, used for 3D terrain and surface analysis in GIS.
How does a TIN model represent terrain?
Tap to revealBy connecting points with known elevation values into triangles that together form a seamless, irregular network of facets.
What happens to a raster surface model’s detail if you use larger grid cells?
Tap to revealDetail decreases as each cell covers a larger area, reducing the model’s ability to capture fine terrain features.
Which GIS surface model uses connected triangles to represent terrain features?
Visualize the differences between a raster DEM and a TIN surface using GIS software.
- Find a DEM dataset and load it in any GIS software (like QGIS or ArcGIS).
- Convert the DEM to a TIN surface using built-in tools.
- Examine both models—note where the grid loses detail and where TIN captures small features.
Think about a project or problem you might tackle with GIS. How would choosing a raster versus a vector surface model impact your results and decision-making?
Choosing the right surface model in GIS—raster or vector—depends on the analysis goal, the level of detail needed, and the available data.
How confident are you that you can explain the difference between raster and vector surface models to a peer?
The Shift
- GIS surface models add a third dimension to mapping, representing the real shape of the Earth’s terrain.
- Raster-based DEMs are great for wide-area analysis; vector-based TINs offer higher precision for detailed work.
- Choosing the right surface model depends on your project’s goals, the level of detail needed, and the available data.