Building a Model
How can you turn complex geographic criteria into a clear, repeatable GIS model that delivers actionable results?
Every GIS analysis is a journey: from messy data and fuzzy goals to crisp, actionable maps. But what transforms scattered datasets and criteria into reliable insights? The answer is model building—a process that lets you design, test, and refine your approach until you arrive at the smartest solution.
Whether you use map algebra or any other GIS tools, your analysis will likely involve multiple datasets along with a variety of tools and techniques. Combining these into logical steps is what GIS folks call model building. This section walks you through the process of planning your model, preparing data, and implementing a GIS model from start to finish.
Some GIS models are so well-designed that they can be shared and reused across projects, saving countless hours and helping teams standardize their analyses.
Imagine you’re tasked with finding the perfect location for a solar farm. You have access to elevation and city boundary data—but which sites are best? By transforming your criteria into a visual diagram and then a GIS model, you can quickly pinpoint areas that meet all requirements, optimizing both time and precision.
What types of projects in your life or career could benefit from a structured modeling approach?
Planning your analysis
Whether you’re going on a vacation or baking cookies, you typically work with a plan. Every model of an activity begins with a plan outlining the steps needed to complete the task at hand. Although plenty of software tools are available for you to use to outline your steps, I find the best place to start is to simply go analog — in other words, grab a pen and paper! Start by diagramming the steps needed to complete your analysis, as I’ve done in the diagram below. I find it easiest to start by writing the desired outcome across the top of the page, so I always have that in mind. Then break that down into smaller pieces like the criteria and data needed.
To show you how this might look, take a look at the diagram below. Here I outline the basic requirements for developing a map of ideal sites for a hypothetical solar farm called Solsites. The ideal sites need to meet these criteria:
- Each site must be at least two miles from town.
- Each site should be on slopes between 30 and 55 degrees.
- The slopes must be south-facing for optimal sun exposure.

Getting this information down on paper helps to keep the steps organized, ensure that all criteria are included, and even identify data needed to complete the process. Essentially, it’s a visual diagram of your model. You can, of course, do something similar using a spreadsheet, bullets in a text document, or notes scribbled on a whiteboard. Use whatever works best for you; the point is to roughly outline your process before jumping into the modeling tools.

Keep your outline handy so that you can refer to it as you create your model. If additional criteria come into play or things change, you can always modify your draft outline. If you’re pretty sure that changes will be needed, try using a whiteboard so that you can easily erase and modify as needed.
Notice how, in the diagram below, the chart is divided by the three requirements for an ideal site location: good slope, good aspect, and good distance from town. Then I list the specific requirements for what makes a site “good” along with the data I will need in order to find my ideal site.
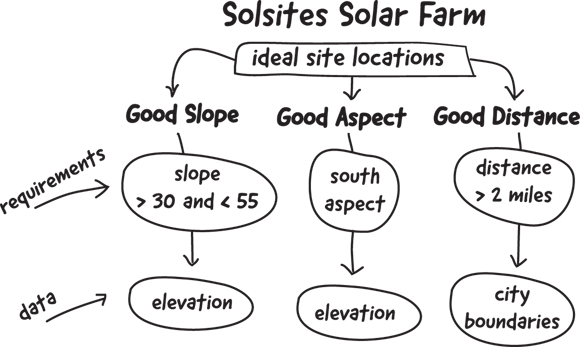
By laying out your process with a basic outline, you not only jump-start your “plan of attack” for the project but also identify your data needs to complete it. At this point, don’t worry about whether the data you need are available; you’ll work on that in the next step. Here, just concentrate on the overall process.
How does outlining your model visually help clarify the steps and data you’ll need?
Preparing your data inputs
After you lay out your plan for a project, such as locating the ideal site to build a solar farm, it’s time to gather and prep the data. Gathering and prepping your data will most likely include the following:
- Identifying and downloading datasets, such as elevation, land use, or city boundaries
- Cleaning and reclassifying data to match your criteria
- Aligning datasets by resampling rasters to the same resolution or projecting layers to the same coordinate system
Keep track of the tools you use in your data prep. If you know you’ll be using these workflows again in the future, you can incorporate the data preparation methods into your model or even build stand-alone models for cleaning and prepping the data for use in other projects.
In environmental consulting, model-driven GIS workflows are used to evaluate land suitability, minimize risk, and speed up regulatory approval for projects like wind farms, pipelines, and conservation areas.
Want to go deeper? The science behind GIS data preparation
Data preparation in GIS isn’t just about organizing files—it’s about ensuring spatial consistency, accuracy, and relevance. Reclassifying data means grouping values to match your criteria (e.g., reclassifying slope into “suitable” or “unsuitable”). Aligning datasets is crucial because mismatched resolutions or coordinate systems can distort results, making your model unreliable. Professionals often automate these steps for repeatability and consistency across analyses.
Why is it important to align datasets before running a GIS model?
The process of combining datasets, criteria, and tools into a structured sequence of steps to solve a GIS problem.
The process of cleaning, reclassifying, and aligning datasets to ensure they meet the requirements of your GIS model.
Grab a pen and paper or open a digital note and outline the steps for a GIS analysis you might want to run—such as mapping suitable locations for a community garden or identifying areas at risk for flooding.
- Write your desired outcome at the top.
- List the criteria and data you’ll need.
- Sketch a flowchart showing how you’ll combine these criteria to arrive at your solution.
- You can outline your GIS model by starting with the end goal and breaking down requirements.
- You understand the basics of preparing data inputs (identifying, cleaning, aligning datasets).
Implementing your model
Modern GIS software makes model implementation accessible by providing tools like ArcGIS Pro’s ModelBuilder and QGIS’s Model Designer, which allow you to drag and drop processes into a flowchart-like interface. With these tools, you can build a sequence of steps, define parameters, and even add descriptions for each process to document your model’s purpose and logic. The saved model can be shared, reused, and adapted by others.
For example, take a look at the model for the hypothetical Solsites project in ArcGIS Pro’s ModelBuilder. It includes the input digital elevation model (DEM), slope and aspect calculations, along with buffered city boundaries — all in one automated workflow. The output of this model is a raster layer that highlights the areas that meet the Solsites criteria for slope, aspect, and distance from cities.
Automated modeling tools save time and reduce errors. Plus, with a drag-and-drop interface, they let you easily tweak and repeat your analysis as needed, which is great for refining results or experimenting with different criteria. Try it on your next project, and you can thank me later for how much time it saved you!
Practitioners often document every step in their GIS models, including data sources and parameters. This transparency makes it easier to troubleshoot, share, and adapt models for new projects.
Building a GIS model lets you transform complex geographic criteria into a repeatable, visual workflow that produces reliable, actionable results.
By laying out your process with a basic outline, you not only jump-start your “plan of attack” for the project but also identify your data needs to complete it.
Model building in GIS is only for advanced users and large projects.
Anyone can build a GIS model—even for small, personal projects—by outlining their steps and criteria visually and logically.
What is model building in GIS?
Tap to revealModel building is the process of combining criteria, datasets, and tools into structured steps to solve a GIS problem.
What is the first step in building a GIS model?
Tap to revealThe first step is planning your analysis by outlining your criteria and desired outcome.
Why is data preparation important in GIS modeling?
Tap to revealData preparation ensures datasets are clean, reclassified, and aligned, which makes models accurate and reliable.
Think of a project or problem you’d like to solve using GIS. How would you break it down into criteria, data needs, and modeling steps? Describe your plan and how you’d visualize it for clarity.
Which of the following is NOT a typical step in preparing data inputs for a GIS model?
The Shift
- Planning your GIS model visually and logically is essential for clear, actionable analysis.
- Data preparation—cleaning, reclassifying, and aligning—is the backbone of reliable GIS modeling.
- Modern GIS tools empower you to automate and share models for faster, more consistent results.