Where does the water go when it rains? The answer to this question is critical for things like flood management, erosion control, and environmental planning. You’ll often hear terms like “watersheds” and “basins” used to describe areas where water drains to a common outlet, like a stream, river, or lake. Although these two terms are often used interchangeably, there are subtle differences worth noting:
- Watershed: This term is commonly used in environmental studies, conservation, and planning. It focuses on water flow and resource management within a defined area.
- Basin: This is a broader term often applied to larger or geologically significant drainage systems, particularly in hydrology and geology.
The Mississippi River Basin is one of the world’s largest, covering parts of 31 US states and two Canadian provinces—an example of how basins can span vast areas and influence millions of lives.
For simplicity, when working in GIS you can think of these two types of draining areas as the same. GIS uses both terms to describe the practical steps for mapping and modeling these systems. No matter the terminology, it’s important to understand how water moves and pools within these areas, and GIS is the perfect tool for the job.
When you look at a city or landscape after a heavy rain, where do you think the water goes? What factors might influence its path?
Understanding watersheds
A watershed acts like a giant funnel: every drop that falls within its boundaries flows downhill, eventually draining into the same outlet, like a stream or river. The watershed boundaries are defined by the topography of the land, and the way the water moves depends on the type of terrain, as follows:
- Steep watersheds: On steep slopes, water rushes downhill rapidly, carving channels and carrying sediment along the way.
- Gentle watersheds: In flatter areas, water moves more slowly, pooling in low spots, and creating wetlands.
By using GIS tools like a Digital Elevation Model (DEM), you can analyze how water flows through both steep and gentle watersheds, helping you predict flooding, mitigate erosion, and plan water infrastructure.

Watersheds are made up of the area upslope from a stream network. Any rain that falls within the watershed boundary can flow overland into the streams below. By mapping watershed boundaries, GIS helps you uncover the dynamics of water flow and its effects on the landscape.
Why do you think it’s important to accurately map watershed boundaries when planning new developments or restoring natural habitats?
Want to go deeper? The science behind elevation models in GIS
Digital Elevation Models (DEMs) are raster datasets that assign elevation values to each cell in a grid. By analyzing the differences in elevation between neighboring cells, GIS software can determine the direction and accumulation of water flow. This process is known as flow-direction and flow-accumulation analysis. These tools are foundational for hydrological modeling, flood forecasting, and even predicting how pollution might spread through a landscape.
An area of land where all precipitation drains to a common outlet, such as a stream, river, or lake, defined by the surrounding topography.
Working with basins in GIS
To map basins in GIS, you start with elevation data to determine their boundaries. Basins are formed by ridge lines, which are the high points in the landscape that separate one drainage from another. Within each basin, water flows downhill toward pour points, the lowest points where water drains from one area into another.
Urban planners use basin mapping to predict flood-prone zones and design smarter stormwater management systems, reducing risk to communities and infrastructure.
Figure 13-3 shows how GIS uses elevation grid data to find ridge lines and model water flow within a basin. Each arrow in the flow direction grid represents the downhill path that water takes from one cell to the next. As water flows downslope, it accumulates in lower cells, forming streams and defining the structure of the basin and its tributaries.
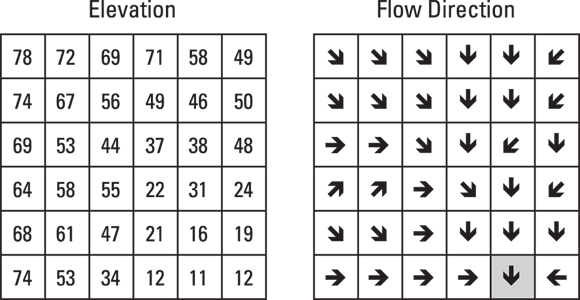
Because basins are closely tied to water flow, mapping them involves the same concepts as those you find in flow-direction analysis. GIS tools calculate water-flow paths and accumulation for you, but knowing how this process works helps you visualize basin boundaries and interpret your results more effectively.

For simpler modeling, start with a “depressionless surface” by filling in minor dips and peaks to create a smooth surface for water to flow over. This ensures smooth water flow and avoids artificial sinks that can complicate your analysis.
To make your model even more realistic, you can add attributes like precipitation levels or surface absorption rates. For example, areas with high rainfall and low absorption (like paved roads) will accumulate more water, which can help with flood modeling.
A larger or geologically significant area where all surface water converges to a single point, separated from other basins by ridge lines.
GIS professionals often use flow-accumulation maps to guide conservation efforts, targeting areas where erosion or flooding is most likely to occur.
Consider a city located at the bottom of a basin. How might mapping the upstream watershed and basin help city officials prepare for heavy rain events?
Watersheds and basins are always the same and can be used interchangeably in every context.
While similar, “watershed” and “basin” differ in scale and context—watershed refers to local drainage areas important for resource management, while basin often describes larger or geologically significant drainage systems.
Accurately mapping watersheds and basins with GIS is essential for understanding water movement, predicting environmental risks, and making informed decisions about land and resource management.
- Watersheds and basins both describe areas where water drains to a common outlet, but differ in scale and usage.
- GIS tools use elevation data to model water flow and define the boundaries of these areas.
Draw a simple watershed and basin diagram to visualize how water moves from higher ground to a central point.
- Take a blank sheet of paper and draw several hills and valleys.
- Mark arrows showing how rainwater would flow downhill, collecting in streams and converging at a common outlet.
- Outline the boundary of the area contributing water to that outlet—this is your watershed.
- Label any ridge lines and low points (pour points) you identify.
Think of a place you know well (your neighborhood, a park, or a local river). How might mapping its watershed or basin help address real-world challenges like flooding, pollution, or conservation? Explain your thoughts, using examples from the lesson.
What is a watershed?
Tap to revealAn area where all precipitation drains to a common outlet, such as a stream, river, or lake, defined by topography.
What is a basin in GIS?
Tap to revealA larger drainage area separated from others by ridge lines, where all water flows to a single pour point.
What is a pour point?
Tap to revealThe lowest point in a basin where water drains from one area into another.
Basin boundaries can be determined without using elevation data in GIS.
Watersheds are made up of the area upslope from a stream network. Any rain that falls within the watershed boundary can flow overland into the streams below.
GIS enables you to map, analyze, and visualize how water flows through landscapes, empowering better decisions for flood control, environmental conservation, and urban planning.
How confident are you that you can explain how GIS uses elevation data to map watersheds and basins?