Ever wonder why Google Maps gives you an estimated time instead of just the distance? That’s because distance isn’t always about how far away a location is; it’s also about how hard it is to get there. Functional distance refers to the costs, effort, or time it takes to get somewhere. It’s the difference between “How many miles is it to the highway?” and “How long will it take me to drive there?” It also helps you plan smarter routes.
Functional distance is the principle behind why GPS apps can suggest alternate routes—even if they look longer—because they may actually save you time or stress.
Functional distance captures the realities of movement, factoring in things like time, money, fuel use, and even emotional effort. For example, that shortcut through the neighborhood might be shorter, but with school zones and stop signs at every intersection, that route may involve some aggravation.
- Fuel and energy use: How much gas does your commute drive consume?
- Cost: Does one route have tolls or parking fees?
- Time: Are there obstacles, speed limits, or other factors that will take more time on one route over another?
- Effort: Is the terrain rugged or smooth? How well maintained is the road?
- Stress level: Are traffic jams or steep, winding mountain roads that add mental strain?

Functional distance isn’t about precision; it’s about practical decision-making.
Think of a journey you take regularly—what factors make it feel longer or shorter than its actual distance?
Navigating non-uniform surfaces (anisotropy)
If you’ve ever walked on a sandy beach, hiked a steep trail, or bicycled into a headwind, you’ve experienced anisotropy, which is a fancy term for uneven travel conditions that you can drop at dinner parties to impress (or confuse) your friends. It’s the opposite of isotropy, which means a perfectly smooth surface that enables equally easy travel in all directions. Isotropy is purely theoretical; it doesn’t exist in nature but gives you a standard to compare surfaces.
Imagine traveling across an isotropic field, with every step requiring the same amount of energy no matter which way you go. Real life isn’t like that, of course; it’s anisotropic. Roads, trails, and natural landscapes introduce resistance, or what GIS gurus call “friction.” Figure 11-5 shows that areas with lower friction allow for faster and easier travel. Factors like slope, surface type, and obstacles all create varying degrees of friction, influencing how far you can go and how quickly you can get there. Each factor contributes to anisotropy as follows:
- Slope: Steeper slopes mean greater effort for vehicles, cyclists, and hikers.
- Surface type: Smooth pavement is a dream compared to soft sand or slippery mud.
- Surface features or obstacles: Dense vegetation or rocky terrain can slow you down dramatically.
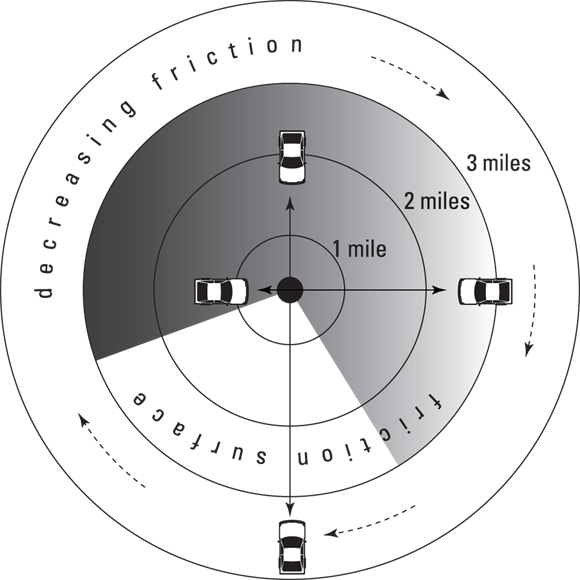
Aside from being a fun term to drop at parties, anisotropy is an important concept to grasp in GIS. It highlights the real-world factors that make travel conditions uneven, like steep hills or rough terrain.
How might the concept of friction surfaces change the way you plan a hiking or biking route?
Friction surfaces in GIS analysis are often modeled using raster grids, where each cell represents the cost of crossing that spot—this could be time, energy, or money. Algorithms like “least-cost path” use these grids to find the most efficient route, factoring in terrain, obstacles, and even subjective preferences. Advanced GIS models also allow for dynamic friction, where conditions change over time (e.g., traffic or weather).
Considering the intangibles
Not all factors affecting functional distance are physical. Sometimes the journey is less about the miles and more about the experience, or the intangibles—those subtle, nonphysical things like how it feels:
- Scenic routes: A longer road through the mountains may be more appealing than a faster freeway.
- Mental stress: Heavy traffic or a narrow, windy, cliffside road may make a shorter trip feel longer.
- Personal preferences: I may prioritize avoiding highways and toll roads, whereas you may opt for the smoothest ride.
Functional distance goes beyond the numbers and reflects the human experience of travel. GIS makes it possible to incorporate these intangible factors into your analysis by combining subjective or qualitative data with traditional data, such as gathering user feedback about city bike paths or factoring scenic route preferences into driving tour designs.
Have you ever chosen a longer route because it was more enjoyable or less stressful?
Urban planners use functional distance analysis to design city bike networks, ensuring routes aren’t just efficient but also comfortable and appealing to riders.
Creating the functional surface
GIS tackles functional distance by creating a friction surface, which is a map layer that assigns resistance values to different areas. High friction means that the route is tough to travel (think dense forests or steep hills), whereas low friction means smooth sailing (like highways or open fields). The friction surface layer becomes the foundation for modeling movement across landscapes.
GIS assigns friction in the following ways:
- Physical resistance: Features like rivers, cliffs, and roads are assigned values based on travel difficulty.
- Human preferences: Intangible factors, like avoiding heavy traffic, can also be incorporated.
- Scalar values: Friction ranges from 0 (no friction) to 10 (impassable), thereby allowing for nuanced modeling.
The practical difficulty, cost, or effort of traveling from one location to another—not just the physical separation.
The condition where movement across a landscape is uneven and varies depending on direction or surface features.
Emergency response teams use friction surface modeling to plan disaster evacuations, choosing routes that minimize time and maximize safety, even in rugged or congested terrain.
The shortest route is always the best route for travel.
Functional distance shows that the best route often depends on obstacles, terrain, costs, and even personal preferences—not just the shortest path.
- Functional distance incorporates time, effort, and other non-physical factors into route planning.
- Anisotropy explains why movement is easier in some directions or surfaces than others.
Compare two routes you regularly take and analyze their functional distance.
- Draw or sketch two possible routes between your home and school/work.
- List the factors (physical and intangible) that affect each route, such as slope, traffic, road quality, and stress levels.
- Estimate which route has the lowest functional distance and explain why.
What does “functional distance” measure?
Tap to revealThe practical difficulty, cost, or effort required to travel between locations—not just the physical distance.
Define “anisotropy” in the context of GIS.
Tap to revealAnisotropy means uneven travel conditions—movement is not equally easy in all directions due to friction, slope, or obstacles.
What is a “friction surface” in GIS analysis?
Tap to revealA map layer that assigns resistance values to different areas based on how difficult they are to travel.
Recall a trip where the shortest route wasn’t the best. Describe the factors that made the longer route preferable and how you would model them in a GIS system.
Which factor is NOT typically included when measuring functional distance in GIS?
Functional distance incorporates real-world factors like effort, cost, and experience—making GIS route analysis much more powerful than simply measuring physical separation.
Understanding anisotropy allows GIS users to model uneven travel conditions, resulting in more realistic and actionable insights for planning and analysis.
Functional distance goes beyond the numbers and reflects the human experience of travel.
The Shift
- Functional distance is the foundation for smarter, more practical route planning in GIS.
- Anisotropy helps explain why travel challenges vary with terrain and direction, making real-world analysis possible.
- GIS can incorporate both physical and intangible factors to create actionable solutions for everyday movement and large-scale planning.