When a raindrop lands on a hill, which way does it roll? Water always takes the path of least resistance, flowing downhill and shaping the landscape as it moves. Understanding how water flows is critical for erosion control studies, flood modeling, and designing structures that can stand up to the forces of nature. GIS tools help you map and model the movement of water by analyzing elevation data to figure out where the water is going and how fast it’s moving.
Some of the world’s most iconic landscapes—like river valleys and floodplains—are shaped almost entirely by the direction and speed of flowing water. GIS helps engineers, urban planners, and environmental scientists understand these processes before making critical decisions.
Understanding why flow direction matters
Flow direction is concerned with not only where water moves but also what happens along the way. The direction determines
- Erosion hot spots: Where erosion is likely to take place
- Flood risk: How quickly the water will move
- Debris movement: The potential destructive force of the moving water on important structures in its path
As an example of the importance of flow direction, building in a floodplain may seem like a good idea until you see how water from upstream accelerates downhill, picking up enough force to wash away structures. Modeling flow in GIS helps identify risks like these before they become problems in real life.
Think of a place you know that regularly floods. How might GIS flow modeling change how people build or plan there?
Water always flows straight downhill, and its path can be predicted by simply looking at a map.
Water flow is affected by subtle elevation changes, local depressions, and landscape features, which GIS can model precisely using grid-based elevation data.
Urban planners rely on GIS flow direction modeling to determine safe zones for new construction, prevent erosion near roads and bridges, and predict flood risks before disaster strikes.
Modeling flow direction in GIS
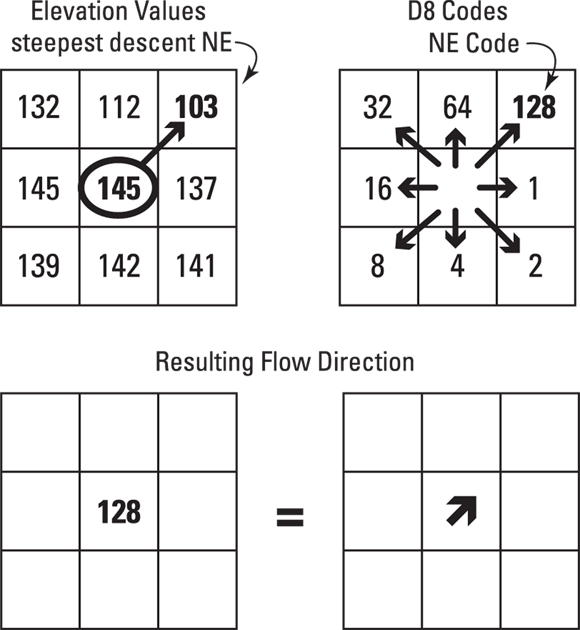
To map water flow, GIS uses a grid of elevation values, typically from a Digital Elevation Model (DEM). Think of this grid as a landscape broken into tiny squares. Each square (grid cell) has an elevation value, and water moves from higher cells to lower ones. Simple enough, right? The following steps, along with Figure 13-4, show how to work with GIS to determine the flow direction:
-
Start with a target cell.
This is the central grid cell (in a 3-x-3 elevation grid) where you want to calculate the direction from which water will flow out.
-
Compare the neighboring cells.
GIS examines the eight surrounding cells and compares their elevation to the central cell’s elevation.
-
Find the steepest descent.
The neighboring cell with the largest elevation drop from the central cell is where water will flow. This drop is calculated using the following formula:
Elevation drop = central cell elevation – neighboring cell elevation
- The largest positive drop indicates the steepest downhill path.
- In Figure 13-4, the lowest drop is the Northeast (NE) cell. Water will flow toward this cell.
-
Assign a direction code.
After finding the steepest path, GIS uses the D8 method to assign a direction code to the central cell. The D8 method (used by both ArcGIS Pro and QGIS) follows a clockwise system, starting with 1 for east and doubling the value as it moves clockwise around the central cell, as shown on the upper right in Figure 13-5. The Northeast cell has a code of 128, so this becomes the direction code assigned to the central cell. Water flows out of this central cell to the northeast.
If you were modeling water flow on a mountain slope, what factors might cause the flow direction to change unexpectedly?
Not every grid cell behaves perfectly. Here are a few quirks you might encounter:
- Flat areas: If all neighboring cells are at the same elevation, water may spread out in all directions. GIS tools often resolve this issue by “filling sinks” (artificially raising depressions) or assigning flow to one direction to simulate movement.
- Local depressions: If all neighbors are higher, the water can pool, creating a “sink” in your model.
- Multiple paths: If several cells have the same steepest drop, the flow may split.
Different GIS software handles these challenges in unique ways. Some expand the search area to find the best drain point; others apply coding schemes to estimate flow direction.
Practitioners often use “sink-filling” algorithms to prepare DEM data, ensuring that flow direction calculations aren’t thrown off by unexpected depressions or flat zones.
Want to go deeper? The science behind flow direction coding
The D8 method assigns flow direction codes using powers of two, making it efficient for computers to process. Each cell’s direction is encoded so that GIS software can quickly trace flow paths across vast landscapes. Some advanced models use more nuanced algorithms—like D16 or multiple-flow direction—to capture complex water movement for hydroengineering and environmental modeling.
A grid-based technique for assigning flow direction codes to cells by comparing elevation and following a clockwise coding system.
A digital representation of the earth’s surface elevation, used as the foundation for flow direction and speed modeling in GIS.
Determining flow speed in GIS
Sure, it’s great to know where water flows, but what about how fast it’s rushing across the landscape? The speed can mean the difference between a gentle stream or a destructive flood.
Here’s a simplified formula to estimate flow speed in GIS:
Flow Speed = Change in Elevation ÷ (Distance ×100)
This formula provides a rough idea of how elevation differences influence movement, though real-world flow speed also depends on factors like terrain roughness and water volume.
On a 3-x-3 grid, the distance between cells depends on their position:
- Adjacent cells: Distance = 1 (for example, north, south, east, west neighbors)
- Diagonal cells: Distance = 1.414 (a longer path across the grid)
- GIS grids allow precise modeling of water flow direction and speed.
- The D8 method assigns direction codes to each cell based on steepest descent.
Use a simple 3-x-3 grid of elevation values to simulate water flow direction and speed.
- Draw a 3-x-3 grid and assign random elevation values to each cell.
- Choose a central cell and calculate the elevation drop to each neighbor.
- Identify the neighbor with the steepest descent and assign the D8 direction code.
- Estimate flow speed using the provided formula, considering both adjacent and diagonal paths.
Why is it important to know not just the direction but also the speed of water flow when planning buildings or roads?
What does the D8 method do in GIS flow modeling?
Tap to revealIt assigns a direction code based on the steepest descent from a cell to its neighbors, indicating where water will flow.
What is a Digital Elevation Model (DEM)?
Tap to revealA digital representation of terrain elevation used by GIS for flow direction and speed modeling.
What is one challenge when modeling flow direction on flat areas?
Tap to revealWater may spread out in all directions, requiring GIS tools to “fill sinks” or assign flow artificially.
Imagine you are tasked with modeling water flow for a new community development. What would be your biggest concern, and how would GIS help you address it?
GIS modeling of water flow—using elevation grids and direction codes—enables us to predict movement, assess risks, and make smarter decisions about erosion, flooding, and construction.
The D8 method is a foundational algorithm for assigning flow direction in GIS, using steepest descent to guide water movement across landscape grids.
Modeling flow in GIS helps identify risks like these before they become problems in real life.
What is the primary purpose of using the D8 method in GIS modeling of water flow?
How confident are you that you can explain how GIS models water flow direction using a DEM grid?
Understanding flow direction is essential for advanced GIS applications such as watershed analysis, stormwater management, and environmental impact assessments.
The Shift
- GIS tools model water flow by analyzing elevation grids, helping us predict movement and risks.
- The D8 method assigns direction codes so water flow can be traced across landscapes.
- Knowing both the direction and speed of water flow is critical for designing resilient structures and managing environmental hazards.