Overlay tools are the detective’s magnifying glass of GIS: they reveal how multiple layers interact, overlap, and diverge, offering answers to questions like “Where do risks converge?” or “Which areas are uniquely qualified?” These powerful techniques transform raw spatial data into actionable insights.
Overlay analysis is used by urban planners, environmental scientists, and emergency responders alike — it’s a cornerstone of spatial decision-making across industries.
Overlay tools let you analyze how layers overlap—or don’t overlap—and help you answer questions like “Which areas meet both of my criteria?” or “What’s left when I remove overlapping areas?” These versatile tools work with points, lines, or polygons, allowing you to analyze spatial relationships with different types of data.

The examples in this section focus on common overlay tools available in most GIS software. Although you can apply these methods in both ArcGIS Pro and QGIS, their functionality sometimes differs a bit. Be sure to explore your software’s documentation and play around with the different options. Who knows what stories your data may unveil!
Performing union overlays
A spatial operation that combines all areas from two polygon layers into one output layer, retaining attributes from both.
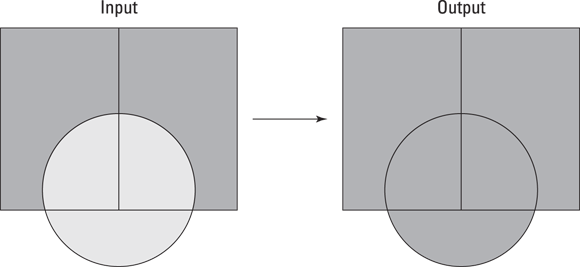
A union overlay, as the name implies, combines all areas from two polygon layers into one output layer. The resulting output layer contains the attributes from both layers, making it a great tool for analyzing overlapping and non-overlapping areas together (see Figure 15-1).
For example, if you’re working in urban planning, you may need to combine planning areas with flood zones to show all regions that are either planned for development, in a flood zone, or both. A union overlay creates a single dataset that includes all attributes from both input layers, ready for further analysis.
- Feature types: In ArcGIS Pro, union overlays support only polygons. QGIS supports points, lines, and polygons. Ideally, the geometry type of the input and overlay layers should be the same.
- Output type: The output is always polygon in ArcGIS Pro, but in QGIS the output type matches the geometry type of the input layers. For example, combining points and polygons will result in two separate runs for each geometry type.
- Attributes: The attributes from both layers are retained in the output.
- Key difference: QGIS’s
Uniontool supports more geometry types, giving you greater flexibility, while ArcGIS Pro limits unions to polygon layers.

Misaligned boundaries in your input layers can wreak havoc on your output layer, leaving you with sliver polygons, which are tiny polygon errors that don’t reflect a real-world feature. To avoid such issues, use snapping or topology repair tools to clean your data before running the Union tool. (See the sidebar later in this lesson for tips on troubleshooting overlay issues).
Want to go deeper? The science behind overlay errors
Sliver polygons often result from tiny mismatches in boundary alignment between input layers. These artifacts can distort the analysis and misrepresent spatial relationships. Data cleaning techniques such as snapping, topology rules, and automated repair tools in GIS software are essential for reducing errors and ensuring your overlay outputs reflect real-world features accurately.
How might union overlays help you see the “big picture” when analyzing multiple datasets?
Using intersection overlays
A spatial operation that retains only the areas where two layers overlap, including attributes from both.
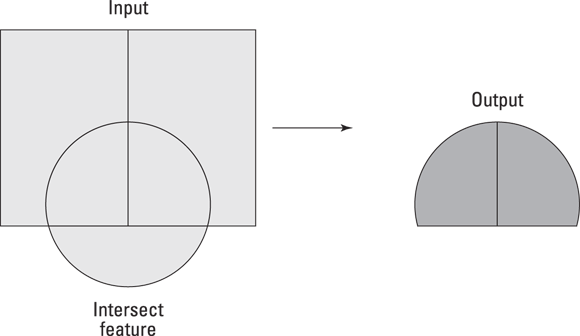
An intersection overlay retains only the areas where two polygon layers overlap. The resulting output layer contains the attributes from both layers but includes only the shared areas, making it a great tool for narrowing down your results to regions that meet multiple criteria (see Figure 15-2).
For example, suppose you’re managing conservation efforts and want to find areas that are both in a conservation district and on public land. An intersection overlay keeps only the overlapping areas from both layers, along with their attributes, so that you can focus on just the areas that meet your criteria.
- Feature types: Both platforms support points, lines, and polygons as input or output geometry.
- Output type: The output feature type is based on the lowest-dimensional type of input (with points being the lowest, followed by lines and then polygons).
- Attributes: The attributes from all input layers are retained in the output layer.
- Key differences: ArcGIS Pro requires you to specify an output feature class, but with QGIS you can create a temporary output for quick analyses. You can, however, use scripting tools in ArcGIS Pro if you want temporary results. ArcGIS Pro also has advanced options for precision adjustments or coordinate systems if needed.
Use an intersection overlay when you need to focus on areas with multiple shared characteristics, such as areas eligible for development based on zoning and floodplain data.
What kinds of questions could intersection overlays help you answer in your own GIS projects?
Overlay tools only work with polygon data.
Both union and intersection overlays in QGIS can be applied to points, lines, and polygons—offering much broader flexibility than many users realize.
Conservationists often use intersection overlays to target areas for protection that meet multiple ecological criteria, such as habitat overlap and endangered species presence.
Practitioners recommend cleaning your spatial data before overlay operations, especially when working across different sources or formats, to avoid sliver polygons and ensure accurate results.
Practice overlay operations with sample layers:
- Download two sample polygon layers, such as land use zones and flood zones.
- Use the union tool to combine them, then examine the resulting attributes.
- Use the intersection tool to extract only the overlapping areas.
- Compare the outputs and reflect on how each tool changes the analysis.
- Union overlays combine all areas and attributes from two layers.
- Intersection overlays retain only the overlapping regions, narrowing the focus for analysis.
How could you use union and intersection overlays to analyze risks or opportunities in a public health or environmental context?
Advanced overlay techniques allow you to combine and compare spatial layers, revealing patterns and relationships that would otherwise remain hidden.
Cleaning and aligning your spatial data before overlay operations is essential to avoid errors and ensure meaningful results.
Overlay tools let you analyze how layers overlap — or don’t overlap — and help you answer questions like “Which areas meet both of my criteria?” or “What’s left when I remove overlapping areas?”
Union Overlay
Tap to revealCombines all areas from two layers, including their attributes, to produce a comprehensive output layer.
Intersection Overlay
Tap to revealRetains only the areas where input layers overlap, preserving all attributes from both layers.
Sliver Polygon
Tap to revealA tiny polygon created by misaligned boundaries, often resulting from errors during overlay operations.
Reflect on a situation where overlay analysis could uncover opportunities or risks in your field (urban planning, conservation, disaster response, etc.). How would you approach the data cleaning process, and which overlay technique would you choose for your analysis?
Which overlay technique retains only the overlapping areas between two spatial layers?
How confident are you that you can explain the difference between union and intersection overlays?
The Shift
- Overlay techniques are essential for analyzing complex spatial relationships across multiple data layers.
- Union overlays provide a comprehensive view of all areas and attributes, while intersection overlays help focus on areas that meet multiple criteria.
- Data cleaning and boundary alignment are critical steps before performing overlays to ensure meaningful, error-free results.