Modeling Visibility with Viewsheds
How do GIS professionals determine exactly what can be seen — and what remains hidden — from any location on a landscape?
Imagine standing atop a scenic hill, gazing at the world below. What you see (and what you can’t) isn’t just about the view — it’s the result of spatial patterns, terrain, and clever GIS analysis. Welcome to the world of viewsheds, where visibility becomes a tool for planning, problem-solving, and discovery.
A visual representation showing which areas are visible or hidden from a specific observation point, based on the surrounding terrain and obstructions.
A viewshed is a visual representation that shows what is or is not visible from a specific location. For instance, if you’re standing outside, your viewshed is everything within your line of sight, although what you can’t see may also be important for your analysis. Whether you’re planning a scenic overlook, designing cell tower placements, or figuring out how to hide something in plain sight, viewsheds are a go-to tool for analyzing visibility.
Viewshed analysis isn’t just for the outdoors — theme park designers use it to create dramatic reveals and hide unappealing service areas from visitors’ sightlines!
When running a viewshed analysis, you analyze visibility in two ways:
- Point-to-point: Is your observation point able to see a specific target? The point-to-point method is perfect for checking whether a newly built fire lookout tower overlooks a critical forested area.
- Path-based: What can you see (or not see) along a route? Hikers use the path-based method to ensure that their trails have great views. Urban designers use this method to avoid visible infrastructure eyesores.
Think of a time when seeing (or not seeing) something from a certain place made a difference for you — what factors do you think determined that visibility?
Using viewsheds in the real world
Viewsheds aren’t just scenic views; they also help you solve practical problems. Also, they take into account both what you can see and what you can’t. Following are some examples of how industries and organizations use them:
- Telecommunications: Viewsheds are used by telecommunications companies to find the best spot for cell towers so that signals reach as many people as possible.
- Urban design: Viewsheds help urban designers hide highways from residential neighborhoods by strategically placing terrain barriers or trees.
- Military: A viewshed can pinpoint hidden areas to safely position troops and equipment.
- Real estate: Real estate developers can use a viewshed to plan a resort with uninterrupted mountain views while keeping unsightly buildings out of sight.
- Natural resources: Viewsheds help the Forest Service, park services, and other agencies locate fire watch towers so that observers can clearly see and monitor large areas for signs of wildfire.
Telecommunications companies rely on viewshed analysis to optimize cell tower placement, ensuring strong signal coverage and minimizing dead zones for customers.

Deciding whether your project needs a viewshed analysis is simple. Just ask yourself: “Does terrain affect whether I can see certain features?” and “Do I want to see those features?” Then let your GIS tool do its magic! ArcGIS Pro has Spatial Analyst tools like Viewshed and Visibility, and QGIS has tools like Viewshed Analysis and r.los (Line-of-Sight).
How might viewshed analysis shape the decisions made by city planners, emergency responders, or architects?
Simulating line-of-sight with ray tracing
Imagine that you’re in a dark room illuminated only by the flashlight in your hand. The beam of the flashlight reveals what’s in front of you while shadows hide what’s behind obstacles in your path. That’s essentially how a method called ray tracing works in GIS. Ray tracing simulates how lines of sight travel across the landscape.
A GIS technique that simulates how sightlines travel across landscape surfaces, determining what is visible or hidden from a specific viewpoint.
Ray tracing isn’t just a GIS tool. Animators and game developers use the same technique to create realistic lighting and shadows in 3D graphics. In GIS, this technique is a big deal for modern applications like the following:
- Solar analysis: Architects use ray tracing to model sunlight and shadows to design energy efficient buildings.
- 5G networks: Telecommunications engineers use ray tracing to find the best spots to place antennas in dense urban areas.
Want to go deeper? The science behind this…
Ray tracing in GIS involves sending out straight lines (“rays”) from the observer’s location to every other cell in a digital elevation model (DEM). If a ray encounters a higher elevation before reaching its target, that point is marked as hidden. This process is repeated for all directions, building up a complete map of visibility. The method is computationally intensive, but optimizations make it practical for real-world projects.
Get hands-on with the concept of viewsheds using a simple mapping tool:
- Find a local hill or tall building on Google Earth or a topographic map site.
- Pick a spot as your “observation point” (e.g., the highest point on the hill).
- Look at the terrain around your point. What can you see? What do you think is hidden by hills, buildings, or trees?
- Sketch or note your estimated viewshed area. Compare with what you see in satellite view — how accurate was your guess?
How ray tracing works in GIS
GIS draws lines from your observation point to every potential point in the landscape. If the line reaches the target unobstructed, that spot is visible. If it hits something like a hill or building, it’s not.
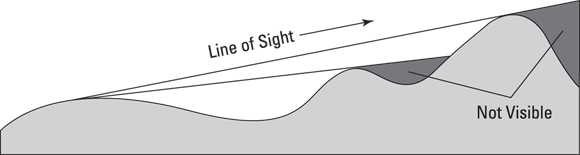

Viewsheds depend entirely on your perspective. If you move your observation point, your viewshed changes, too, just as it does in real life when you take a step sideways to get a better view of a breathtaking canyon.
How might changing the observer’s position or elevation affect visibility outcomes in real-world planning?
Making viewsheds more realistic
In the real world, visibility doesn’t pertain strictly to how high you are. Trees, buildings, and other features can block your view, so be sure to take these factors into account by adding their heights to your model:
- Obstructions: Include layers with height attributes for trees, buildings, and other barriers. For example, if a tree is 30 feet tall, add 30 feet to its elevation value.
- Observer height: If the observer is standing on the ground, add five or six feet for eye level. If observing from a lighthouse (for example), add the lighthouse’s height to your location’s elevation. Keep in mind that the visibility from a lighthouse is much broader than if you’re standing on the ground, so don’t forget to account for height!
To calculate viewsheds, start with a simple Digital Elevation Model (DEM). Then, if you need more realistic results, add additional details like the observer height and obstructions.
Practitioners often fine-tune their models by incorporating detailed local data on vegetation and buildings, which can dramatically change what’s visible in urban or forested areas.
What is a viewshed?
Tap to revealA map or analysis showing which areas are visible or hidden from a specific observation point, based on terrain and obstacles.
What does ray tracing simulate in GIS?
Tap to revealRay tracing simulates the path of lines of sight across the landscape to determine which points are visible or blocked from an observer’s location.
Name one application of viewshed analysis in urban design.
Tap to revealUrban designers use viewsheds to hide infrastructure or highways from residential neighborhoods by using terrain or vegetation barriers.
Describe a scenario in your own life or community where viewshed analysis could make a meaningful difference. How would you use GIS tools to address the visibility challenge?
- Viewsheds show what is visible (or hidden) from a chosen location, helping solve a wide range of real-world problems.
- Ray tracing simulates lines of sight, and adding real-world obstructions makes your analysis far more accurate.
Viewsheds only matter for scenic landscapes and sightseeing.
Viewshed analysis is essential in many fields — from telecommunications to disaster planning — wherever knowing what’s visible or hidden can drive better decisions.
Which GIS technique is used to determine what areas are visible from a specific observation point by simulating lines of sight?
Viewshed analysis empowers you to model and solve real-world visibility problems using GIS — from finding the perfect spot for a cell tower to safeguarding hidden locations.
By incorporating both terrain and real-world obstructions, GIS-based viewsheds become powerful tools for planning, design, and decision-making across industries.
Viewsheds aren’t just scenic views; they also help you solve practical problems.
The Shift
- Viewsheds are powerful GIS tools that reveal what is visible or hidden from any location, with broad applications beyond scenery.
- Ray tracing simulates lines of sight, and factoring in real-world obstructions leads to more accurate and useful analysis.
- Effective viewshed modeling supports better decisions in urban design, telecommunications, emergency preparedness, and more.