Imagine standing at a viewpoint, looking out over a vast landscape. Some features — like mountain peaks or city skyscrapers — stand out sharply, while others blend seamlessly with their surroundings. In GIS, statistical surfaces bring these patterns to life, turning raw data into visual stories that allow us to interpret and analyze the world in new dimensions.
GIS surfaces aren’t just for the outdoors — they’re used in urban planning, public health, agriculture, and even tracking the spread of internet connectivity!
In GIS, the term surface refers to a dataset that represents a continuous phenomenon across space. Think of a map that shows elevation (a physical surface) alongside a map showing population density (a human surface). Both have the same fundamental data structure but tell entirely different stories: one is about the natural world; the other is about human patterns.
Here’s a closer look at these two categories of statistical surfaces:
- Physical surfaces: Think of physical surfaces as nature’s blueprint, reflecting the natural world and its processes. Topography (those curvy contour lines on trail maps) is a classic example, but physical surfaces can also represent subsurface phenomena such as groundwater depth, the thickness of rock formations, or even weather-related variables such as temperature, air pressure, and precipitation. Physical surfaces help you visualize and analyze the natural world, both above and below ground.
- Human surfaces: The term human surfaces refers to distribution patterns of people, including socioeconomic factors like population demographics (age, income, education), housing costs, taxes, and crime rates. Human surfaces even include mapping attitudes and beliefs like voting trends or economic optimism. But here’s the kicker: Human surfaces aren’t continuous. Instead, they often occur in distinct locations, which means that you sometimes have to assume that they’re spread evenly across space so that you can analyze them effectively.
A dataset in GIS representing a variable that changes across geographic space, such as elevation or population density.
The measurement at a specific location on a surface (like elevation, temperature, or crime rate) that adds a dimension of meaning to X and Y coordinates.
What are examples of physical and human surfaces you encounter in everyday life, and how might they be mapped in GIS?
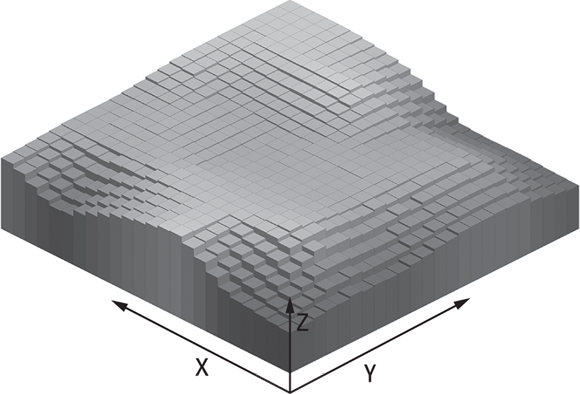
Every surface, whether physical or human, boils down to the three ingredients depicted below:
- X and Y coordinates: These coordinates tell you where the data point is located on the map.
- Z value: This number describes the surface by representing the feature’s value at that location (like elevation or crime rate). For example, an elevation surface might have Z values of 500 meters in a valley and 1,500 meters on a mountaintop.
- Spatial variation: The surface changes as Z values vary across it, creating high points (peaks), low points (valleys), and flat areas.

The X and Y coordinates define location, but Z values add another layer of information to your data. In many cases, Z values represent elevation, giving data a true third dimension, but they can also represent any measured value at a location, such as temperature, pollution levels, or even crime rates. Mapping X, Y, and Z values, such as the sample surface shown below, creates a visual representation of highs, lows, and trends, which makes your data much easier to understand at a glance.
Why do you think it’s important for GIS surfaces to include the Z value, and how does this change the way you interpret data?
Understanding discrete and continuous surfaces
In GIS, surfaces are either discrete or continuous. The map on the left shows buildings and trees scattered in specific spots (discrete), whereas the image on the right depicts elevation data that flows across the surface (continuous). Here are more details about discrete versus continuous surfaces:
- Discrete: On a discrete surface, data shows up in specific spots but doesn’t exist everywhere in between. These surfaces often represent items you can count, such as houses on a block, trees in a park, or crime incidents by address. On a map, discrete surfaces look blocky or pixelated because each data point is separate and distinct. For example, a map of tree cover shows each tree as a distinct point, creating a discrete surface.
- Continuous: With a continuous surface, every part of the surface has a measurable value that blends naturally across the landscape. For example, the image on the right side shows the continuous change of elevation values at Valles Caldera National Preserve, New Mexico, from 1,575 meters in the low areas to 3,525 meters at the top.
Knowing the difference between discrete and continuous surfaces is important for choosing the right tools in GIS. Discrete surfaces work well for mapping specific, countable features like schools or car accidents. Continuous surfaces, on the other hand, are ideal for visualizing smooth transitions, such as elevation, rainfall patterns, or population density modeled as a heat map.

Continuous surfaces technically have infinite data points, which means that every spot on the map has a value. If you tried to include all this data in one GIS database, you would need that database to have infinite storage capability, which isn’t possible. Instead, GIS tools sample the surface, collecting just enough data points to analyze with an acceptable degree of accuracy while saving storage space. You can discover more about how sampling works in the section “Sampling statistical surfaces,” later in this module.
How would you decide whether to use a discrete or continuous surface for a new GIS project?
City planners use discrete surfaces to map locations of schools and fire stations, while meteorologists rely on continuous surfaces to model temperature, rainfall, and air pressure across an entire region.
All surfaces in GIS are continuous, just like elevation maps.
Many surfaces — especially those representing human phenomena like crime incidents or building locations — are discrete, not continuous, and require different mapping techniques.
Mapping X, Y, and Z values creates a visual representation of highs, lows, and trends, which makes your data much easier to understand at a glance.
- Learned the difference between physical and human statistical surfaces
- Explored the role of X, Y, and Z values in defining surface data
- Distinguished between discrete and continuous GIS surfaces
Want to go deeper? Why are some human surfaces “forced” to be continuous?
Human data, like population or income, often exists in isolated locations (think census blocks or survey points). But to analyze trends and visualize patterns, GIS analysts sometimes interpolate or “smooth” this data, creating a continuous surface. This process helps reveal gradients or clusters that would remain hidden if the data were only mapped at their original, discrete points.
Practitioners often use both discrete and continuous surfaces together. For example, environmental scientists may overlay discrete pollution sources on a continuous air quality model to study how specific factories contribute to regional pollution patterns.
Explore an online map (like Google Maps or your local GIS portal) and identify one physical and one human surface layer.
- Find a map that displays elevation, land cover, or soil type (physical surface).
- Toggle on layers showing population density, income, or crime reports (human surface).
- Note how these surfaces are displayed differently. Are they continuous, discrete, or a mix?
Describe a situation where misclassifying a GIS surface as discrete or continuous could lead to a faulty conclusion or poor policy decision. How would you avoid this pitfall in your own analysis?
What is a physical surface in GIS?
Tap to revealA dataset representing natural phenomena, such as elevation, temperature, or groundwater depth, that varies continuously across space.
Define a human surface in GIS.
Tap to revealA surface representing distribution patterns of people or human-related data, such as population, income, or crime rates; often discrete but sometimes modeled as continuous for analysis.
What do X, Y, and Z values represent in GIS surfaces?
Tap to revealX and Y specify geographic location, while Z provides the measured value at that point (such as elevation or temperature).
Discrete vs. continuous surface: key difference?
Tap to revealDiscrete surfaces have data only at specific spots; continuous surfaces have measurable values everywhere across the area.
Which of the following is an example of a continuous surface in GIS?
Understanding the distinction between discrete and continuous statistical surfaces is essential in GIS for selecting the right analysis methods and accurately interpreting geographic patterns.
Z values transform flat maps into powerful three-dimensional models, enabling more intuitive visualization and analysis of both natural and human phenomena.
How confident are you that you can explain the difference between a discrete and a continuous surface in GIS?
The Shift
- Statistical surfaces in GIS can represent both natural (physical) and human phenomena, each requiring different analysis approaches.
- Z values add a crucial third dimension, making patterns and trends visible and actionable in spatial analysis.
- Choosing between discrete and continuous surfaces is foundational for effective mapping and decision-making in GIS.