Streams are more than just water flowing downhill—they are nature’s engineers, sculpting land, connecting habitats, and fueling ecosystems. Understanding how to define and map them is foundational for any geographic analysis involving water, terrain, or environmental planning.
The world’s longest river network, the Amazon, covers an area so vast that some of its tributaries are larger than entire rivers on other continents.
Streams are nature’s highways, carving through landscapes, collecting rainwater, and branching into tributaries that create complex networks. These networks don’t just move water; they shape ecosystems, control water flow, and even influence the land around them.
Whether you’re studying erosion, managing water resources, or protecting habitats, mapping streams in GIS helps you analyze these networks and their connections.
Understanding stream networks in watersheds
Streams are part of larger systems called watersheds. A watershed is like a giant funnel, encompassing an area where all water in it drains to a common point, such as a stream or river. Explore the key parts of a stream network:
- Trunk stream: The main channel into which smaller streams flow
- Tributary streams: Smaller streams that flow into and feed the trunk stream
- Sub-basins: Smaller sections of a watershed that drain into a larger stream, river, or reservoir within the same watershed
- Pour points: The lowest points where water converges and exits into the trunk stream or leaves the watershed
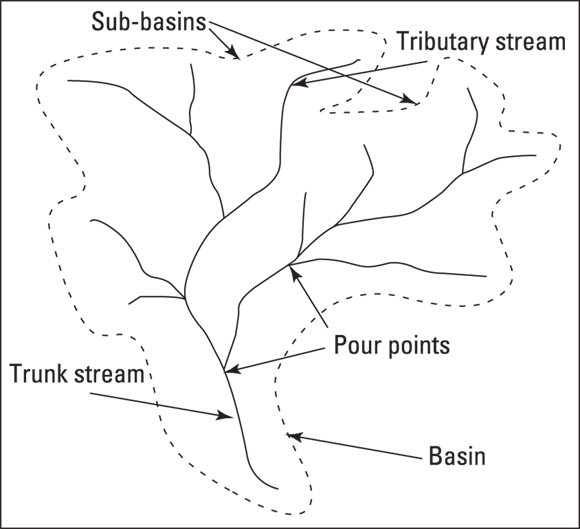
Think about a local river or stream you know—can you identify its trunk, tributaries, and possible pour points?
An area of land where all water drains to a single common outlet, such as a river, stream, or reservoir.
Locating streams in GIS
When working with vector data, finding streams is as simple as selecting lines labeled as streams. But with raster data, you can do so much more than locate streams—you can model their flow, identify tributaries, and analyze how water accumulates in a basin.
Streams form naturally in areas where water collects and flows downhill, often following low spots in elevation. To locate these streams in GIS, you use a Digital Elevation Model (DEM) and follow these basic steps:
-
Define the basin edges.
These are the highest points that form the boundaries of a drainage basin (think of them as the “rims” of a funnel, where all water within an area will eventually flow to a single stream, river, or reservoir).
-
Identify the pour points.
Pour points are the lowest points in each sub-basin where water drains and joins a stream. These junctions mark where smaller tributaries meet.
-
Trace the streams.
Work upward from the pour points, identifying paths of water flow based on elevation.

A pour point acts like a drain hole for a specific area. Water flows downhill into it and eventually joins the larger stream network (see the diagram above).
Why do you think GIS analysts often rely on DEMs (Digital Elevation Models) to map streams rather than only drawing them manually?

To simplify stream network analysis, assign a unique value to cells with high flow accumulation in your raster dataset and set all other cells to NODATA. This makes it much easier to overlay stream data with other layers, like land use or precipitation.
For example, use these expressions in the Raster Calculator tool of your GIS software to isolate streams from your flow accumulation data (assuming your raster is named flowAccum.tif and a stream is any cell where flow accumulation is greater than 1,000):
-
ArcGIS Pro:
Con("flowAccum.tif" > 1000, 1) -
QGIS:
("flowAccum.tif" > 1000) * 1
These expressions assume that streams have high flow accumulation values, but you can adjust the threshold (1,000 here) depending on your dataset and study area.
Practice extracting streams from a DEM-based flow accumulation raster.
- Open your GIS software and load a flow accumulation raster layer.
- Use the Raster Calculator to apply the condition “
flowAccum.tif > 1000“. - Assign a value of 1 to cells meeting the condition and set the rest to
NODATA. - Visualize your result and compare it to a basemap or stream feature layer.
- You can now identify the main components of a stream network and watershed using GIS.
- You understand the basic steps for extracting streams from raster data.
Practitioners often tweak the flow accumulation threshold based on local rainfall, terrain, and land use to get the most realistic stream networks for their area of interest.
Want to go deeper? The science behind flow accumulation
Flow accumulation models how water would move over a surface based on terrain elevation. Each cell in a DEM “collects” the amount of water that would flow into it from upslope cells. By tracing the cells with the highest accumulation, you effectively mimic how actual streams carve their way through a landscape, even before any water is visible on the ground.
The lowest point in a sub-basin where water drains and joins a stream, marking the junction where smaller tributaries meet the main channel.
Reflect on the river network in your own region. How might changes in elevation or land development affect where streams form and flow?
Identifying methods that work for you
Streams are rarely isolated. They branch into tributaries and merge to form larger streams, creating stream networks. To study these networks, GIS uses a method called stream order, which ranks streams based on their connections. Stream order breaks down like this:
- First-order streams: These streams are the smallest ones with no tributaries. First-order streams form directly from overland flow, springs, or snowmelt.
Hydrologists use stream order analysis to plan flood prevention and conservation projects, ensuring efforts target the right locations in a watershed.
If you were tasked with mapping a city’s stream network for flood risk planning, which GIS methods would you use first, and why?
All streams are equally important when analyzing a watershed.
Streams are organized by order and network hierarchy; trunk streams and key tributaries play outsized roles in shaping water flow and watershed health.
What is a trunk stream?
Tap to revealThe main channel of a stream network into which smaller tributaries flow.
Define a pour point in the context of GIS and hydrology.
Tap to revealThe lowest point in a sub-basin where water drains and joins a stream, marking the confluence in the network.
What does a Digital Elevation Model (DEM) provide in stream analysis?
Tap to revealA raster representation of terrain elevation used to model water flow and identify stream paths.
Which GIS data type allows you to model water flow, identify tributaries, and analyze accumulation in a basin?
GIS empowers you to identify, map, and analyze stream networks—revealing the crucial pathways that shape landscapes and influence water management decisions.
Using Digital Elevation Models and flow accumulation in GIS, you can trace how water moves through even the most complex watersheds.
Streams are nature’s highways, carving through landscapes, collecting rainwater, and branching into tributaries that create complex networks.
How confident are you that you can identify and map streams within a watershed using GIS tools?
The Shift
- Streams are key elements of watershed networks, shaping both landscapes and ecosystems.
- GIS, especially raster analysis with DEMs, enables precise mapping and understanding of stream networks.
- Understanding and isolating stream features is foundational for effective water resource management and environmental analysis.